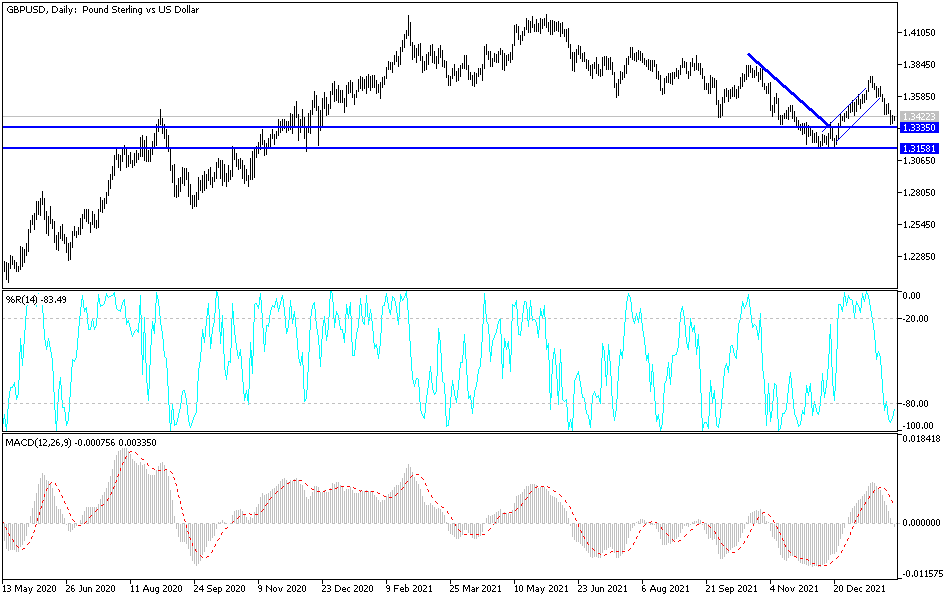
The price of the GBP/USD currency pair is stable at the time of writing the analysis, as it settles around the 1.3425 level. This is a rebound from strong selling operations that the currency pair was exposed to, which pushed it last week to the 1.3358 support level, the lowest in more than a month. The US dollar has been in a strong position recently, as the FOMC statement confirmed that the US central bank is close to raising interest rates. In addition, advanced US GDP for the fourth quarter of 2021 indicated a stronger-than-expected 6.9% growth versus the expected 5.3% expansion.
Inflation from the core PCE price gauge has raised expectations of a US interest rate hike in March as increased price pressures will soon push the Fed to tighten. This could mean plenty of upside for the US dollar, even against the British pound whose central bank is under pressure to tighten as well. This week, the forex market will have an important day with the announcement of the monetary policy decisions of the Bank of England. There are strong expectations that the bank will raise the interest rate from 0.25% to 0.50%, which may provide strong support for the pound.
UK inflation hit a multi-decade high of 5.4% in December, and with (future) energy prices rising sharply in the meantime, BoE policymakers will likely revise higher expectations this week in anticipation of another long period. Prices continue to grow at rates well above the 2 percent target. Some other economists have argued that recent and ongoing cost-of-living increases may leave the BoE reluctant to reverse the rate cuts announced in support of the economy at the start of the coronavirus crisis, which lowered the bank's rate from 0.75% to 0.10%.
The US dollar may be more tempting than the Sterling, although the rise in US inflation is underpinned by stronger growth while the UK faces stagflation problems.
According to the pair's technical analysis: GBP/USD is heading lower on the hourly chart, as it formed lower tops and lower lows within a descending channel. The price bounces from the support level and may be due to a pullback to the top again. The application of the Fibonacci retracement tool shows that this is in line with the 61.8% Fibonacci retracement around 1.3467. A shallow pullback may already find sellers at 38.2% Fibonacci level around the important channel mid-zone at 1.3425 or the 50% level near a minor psychological mark of 1.3450.
The 100 SMA remains below the 200 SMA to confirm that the downtrend is more likely to resume than reverse. The 100 SMA is also near the top of the channel adding to its strength as resistance. If any of the Fibonacci indicators hold, GBP/USD could resume sliding to the swing low of 1.3357 or the bottom of the channel. Stochastic is still pointing up to show that there is some bullish pressure, but the oscillator is also approaching overbought territory to reflect exhaustion. A turn down would confirm the sellers' return. The RSI has more room to go up before reaching the overbought zone, so buyers may stay in control for a bit longer.

