The difference between success and failure in Forex trading is very likely to depend mostly upon which currency pairs you choose to trade each week and in which direction, and not on the exact trading methods you might use to determine trade entries and exits.
When starting the trading week, it is a good idea to look at the big picture of what is developing in the market as a whole and how such developments and affected by macro fundamentals and market sentiment.
There are a few valid long-term trends in the market, so it can be a profitable time to trade right now.
Big Picture 2nd January 2022
Due to the Christmas and New Year holidays, last week’s Forex market saw relatively little price movement, with no high-impact data released at all.
The US Dollar fell again, against its long-term bullish trend. The US Dollar index ended the week notably lower.
Risk sentiment was mixed over the week, after it had improved markedly over the previous week or two. Most stock markets ended the week higher, including the benchmark US S&P 500 Index. Commodities rose, especially crude oil, and in the Forex market the Australian and Canadian Dollars which are commodity currencies and key risk barometers rose, while the safe havens the Japanese Yen and the US Dollar both fell. The general improvement of risk sentiment globally is probably mostly because there is increasing optimism over the impact of the omicron coronavirus variant which has begun to spread extremely rapidly especially in Europe, the USA, and Canada.
I wrote in my previous piece last week that the best trade for the week was likely to be long of the S&P 500 Index, the USD/JPY currency pair following a daily (New York) close above 115.25, and the agricultural commodity Corn in USD terms. The S&P 500 Index rose by 0.68%, while Corn fell by 2.8%, unfortunately giving an average loss of 1.06%. The USD/JPY currency pair did not make a daily close above 115.25.
Fundamental Analysis & Market Sentiment
The headline takeaways from last week were:
Further data from the UK suggested that the fast-spreading omicron coronavirus variant is 70% less likely than previous strains to cause serious disease requiring hospitalization. This news helped lift risk sentiment, boosting stock markets and commodity currencies.
The omicron coronavirus variant continues to spread rapidly around the world. Several European countries and Canada have imposed restrictions on movement and new cases are reaching all-time records by far, with well over 1 million new confirmed cases reported globally. Countries such as the UK and France are reporting close to 200,000 new cases per day. There is some optimism that as this variant seems to cause mostly mild disease, that it may effectively bring the pandemic to some kind of end if it induces widespread immunity, even if temporary.
The coming week is likely to see a higher level of volatility due to the extremely slow schedule and continuation of the Christmas & New Year holiday season last week, with market direction likely to be determined between Wednesday and Friday with US Non-Farm Payrolls data and FOMC Meeting Minutes data releases.
Last week saw the global number of confirmed new coronavirus cases rise to its highest level ever seen. Approximately 58.2% of the global population has now received at least one vaccination.
The strongest growths in new confirmed coronavirus cases overall right now are happening in Albania, Algeria, Argentina, Australia, the Bahamas, Barbados, Belize, Bolivia, Canada, Colombia, Croatia, Cyprus, Denmark, Dominican Republic, Estonia, Ethiopia, Finland, France, Greece, Iceland, Israel, Italy, Jamaica, Kuwait, Lebanon, Luxembourg, Mali,, Malta, Montenegro, Panama, Portugal, Qatar, Spain, Sweden, Switzerland, Turkey, the UAE, the USA, Uruguay, and the UK.
Technical Analysis
U.S. Dollar Index
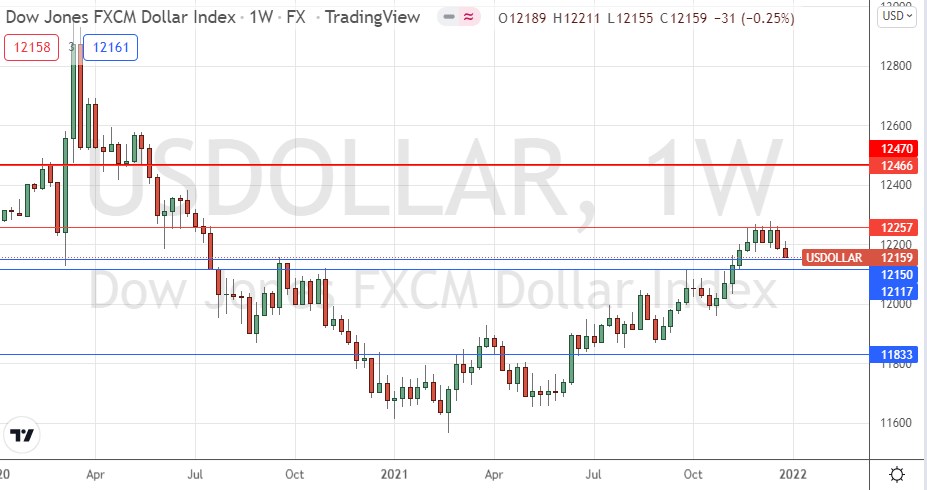
The weekly price chart below shows the U.S. Dollar Index printed a bearish candlestick last week, after previously rejecting the resistance level identified at 12257 two weeks ago. Note how this key resistance level has held again – in fact it held just after the FOMC release some weeks ago when it was tested, which is possibly a bearish sign. While this continued decline is not enough to invalidate the long-term trend (the price is well above its levels from 3 and 6 months ago), it is very notable that there is clearly strong resistance here, which is having impact. This suggests that despite the long-term bullish trend, we may now have experienced a major bearish reversal. However, it is also worth noting that the price is now very close to a major support level at 12150.
Overall, I would not look towards the USD as a key driver for any trades over the coming week. For a while, and possible for the entire coming week, there will likely be momentum against the US Dollar, although the Japanese Yen remains considerably weaker.

USD/JPY
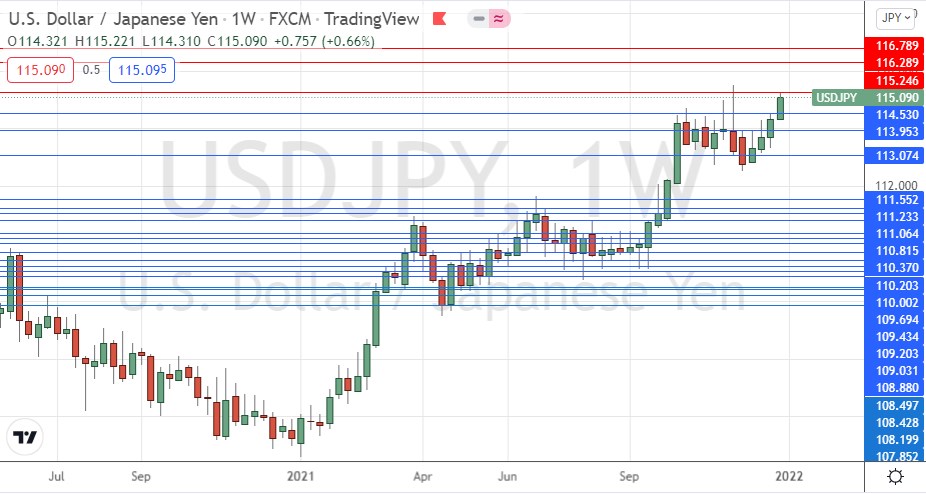
The USD/JPY currency pair made its highest weekly close in 5 years for the second week running, printing a healthy sized bullish candlestick which closed near the top of its range. These are clearly bullish signs that we are likely to see a further rise over the coming days and weeks. However, it should be noted that there were recently several higher daily closes all the way up to the very key resistance level at 115.25. Although the rise in USD/JPY is supported by the improved risk sentiment we are seeing in markets since data began to show omicron as relatively mild, this currency pair is still prone to a sudden selloff below 115.25, so I do not want to go long here until we see a daily (New York) close above 115.25.

S&P 500 Index
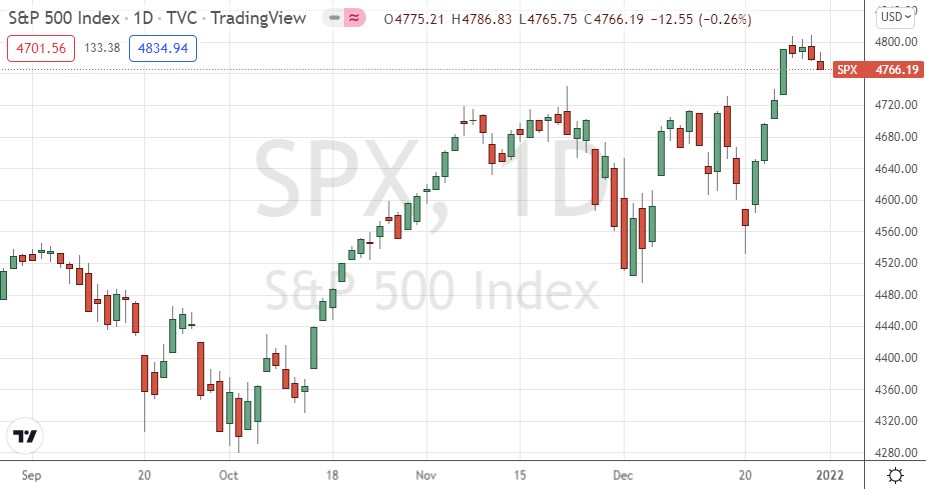
The S&P 500 stock market index made its highest ever weekly close but printed only a bullish candlestick which did not close near the top of its range. There are bullish signs remaining, but it will be worthwhile to be cautious and not buy until we see a daily close above 4800 with a firmly bullish daily candlestick closing.

Bottom Line
I see the best opportunities in the financial markets this week as likely to be long of the S&P 500 Index following a daily close above 4800, and the USD/JPY currency pair following a daily (New York) close above 115.25.
