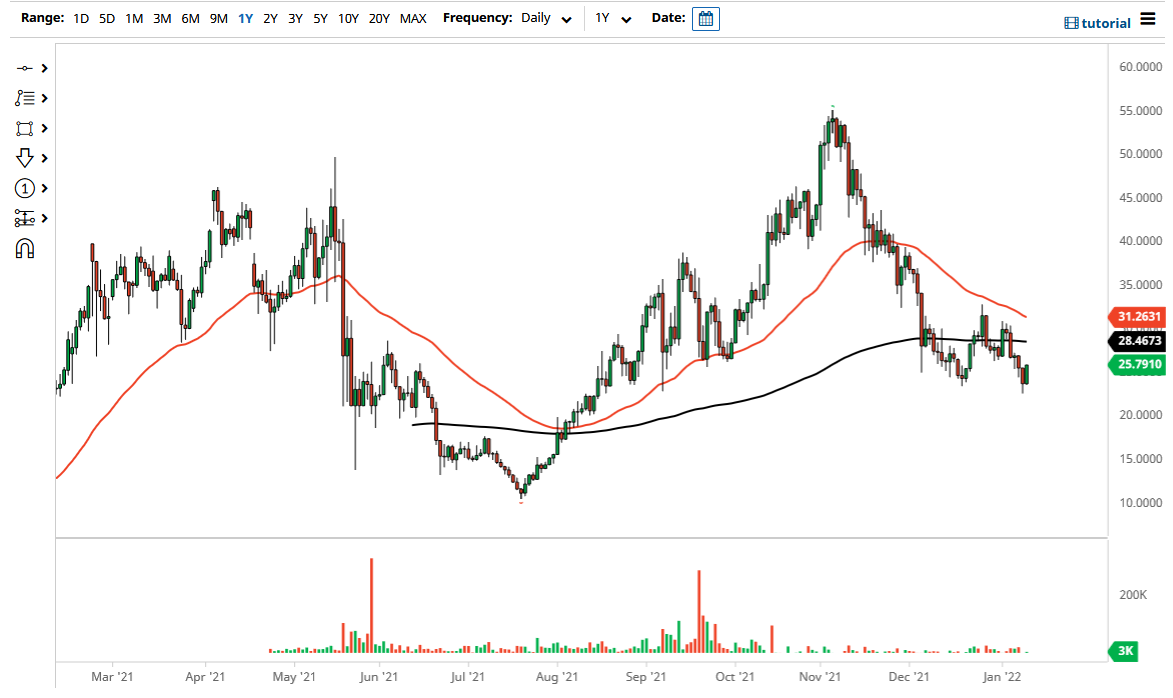
Polkadot has rallied significantly to break above the $25 level during the trading session on Tuesday as it looks like the “risk on” attitude of the markets have come back. Quite frankly, a lot of markets, not just crypto currency, have been oversold for a while so it makes sense that perhaps we get a bit of a bounce. The question at this point is not necessarily going to be whether or not we can bounce, but whether or not we can sustain that bounds? At this point in time, if the market was ready to go looking towards the 200 day EMA, I would anticipate a little bit of noise. That is currently at the $28.46 level.
It is worth noting that the 50 day EMA is currently at the $31.25 level and sloping lower. It looks as if the market is trying to form the so-called “death cross”, but all things being equal that is normally an indicator that is quite late. Because of this, I do not necessarily like the idea of worrying about those indicators, and I think at this point in time it is all about pure price action. The candlestick during the session on Monday certainly looks as if it is positive as well, despite the fact that it was actually negative day. It looks like we could be trying to form some type of “double bottom”, and at this point in time that could be the bottom in theory. That means that the $23 level should continue to be very crucial, which is not a huge surprise considering that it had been supportive in the past.
If the market is able to clear the highs from a couple of weeks ago at the $32.55 level, then it is likely to go much higher, perhaps making a run towards the $40 level, followed by the $55 level. Alternately, if we were to break down below the lows of the trading session on Monday, it is likely that the market could go looking towards the $20 level underneath, which of course has a lot of psychology attached to it. All things been equal, this is a market that continues to see a lot of noisy and choppy behavior but it certainly looks as if we are trying to bounce a bit.

