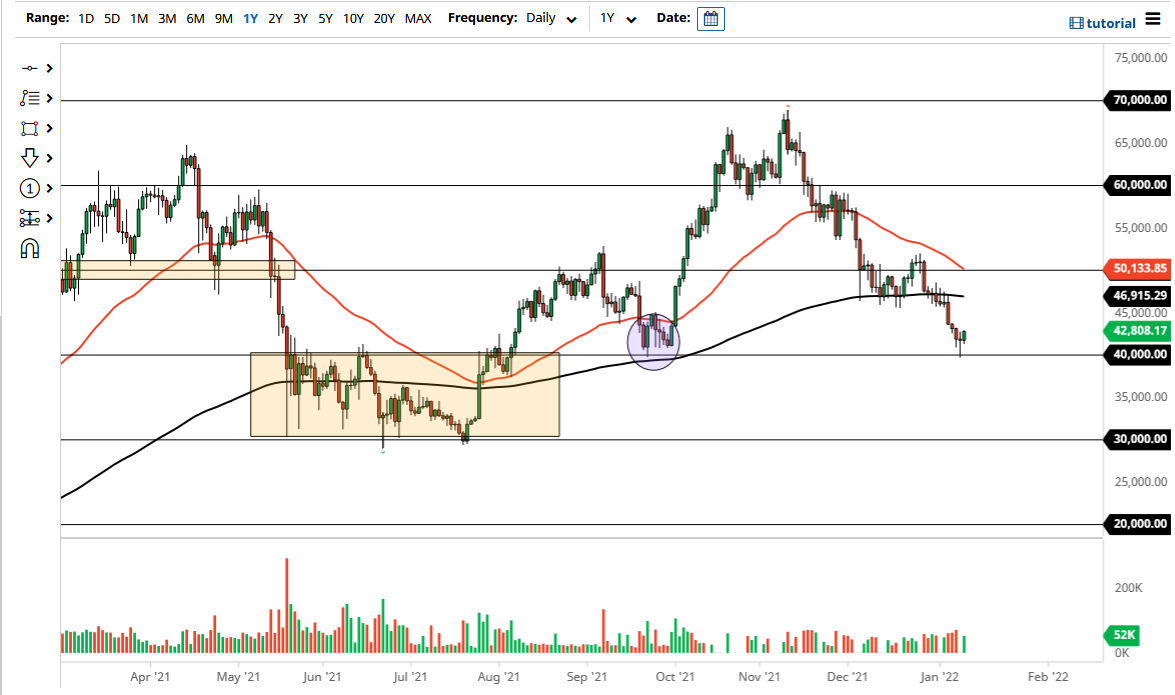
Bitcoin has rallied a bit during the course of the trading session on Tuesday to break above the top of the hammer that was printed on Monday. That hammer is sitting right at the $40,000 level so I do think that we are getting ready to see some type of bounce that might actually matter. The $40,000 level of course offers psychological support and importance and has been structurally important in the past. This makes quite a bit of sense that the Bitcoin market bounces from there, or at least find a bit of stability. At this point, it will be interesting to see whether or not the Bitcoin market can continue to rally from here. If it does, that would be a very bullish sign and could send this market towards the 200 day EMA above near the $47,000 level.
Keep in mind that Bitcoin can drag the rest of the crypto currency market right along with it, so while Bitcoin might be very bullish, you might get more alpha from other coins in smaller markets. Either way, this is the most important indicator in the crypto markets, due to the fact that the Bitcoin market is by far the biggest and therefore it has an outsized influence on other coins.
If we were to turn around and break down below the $40,000 level, then it is very likely that we could open up fresh selling in Bitcoin and other coins as well. The only thing that comes close to the influences Ethereum, and even that pales in comparison to what we see here. Because of this, regardless of what coin you are trying to trade at the moment, this is by far the most important chart to pay attention to. As an example, we have seen Ethereum rise almost 5% right along with Bitcoin, while Polkadot has done similar moves for the day.
Obviously, it works in both directions and that is why I pay close attention to this $40,000 level underneath. It is very likely that we may be trying to find the bottom here, so pay close attention to the next couple of days, as it could very well determine where we go longer term. I do think that perhaps at the very least we need some type of big bounce, and it should be noted that bigger Bitcoin holders do not seem to be bailing out either.

