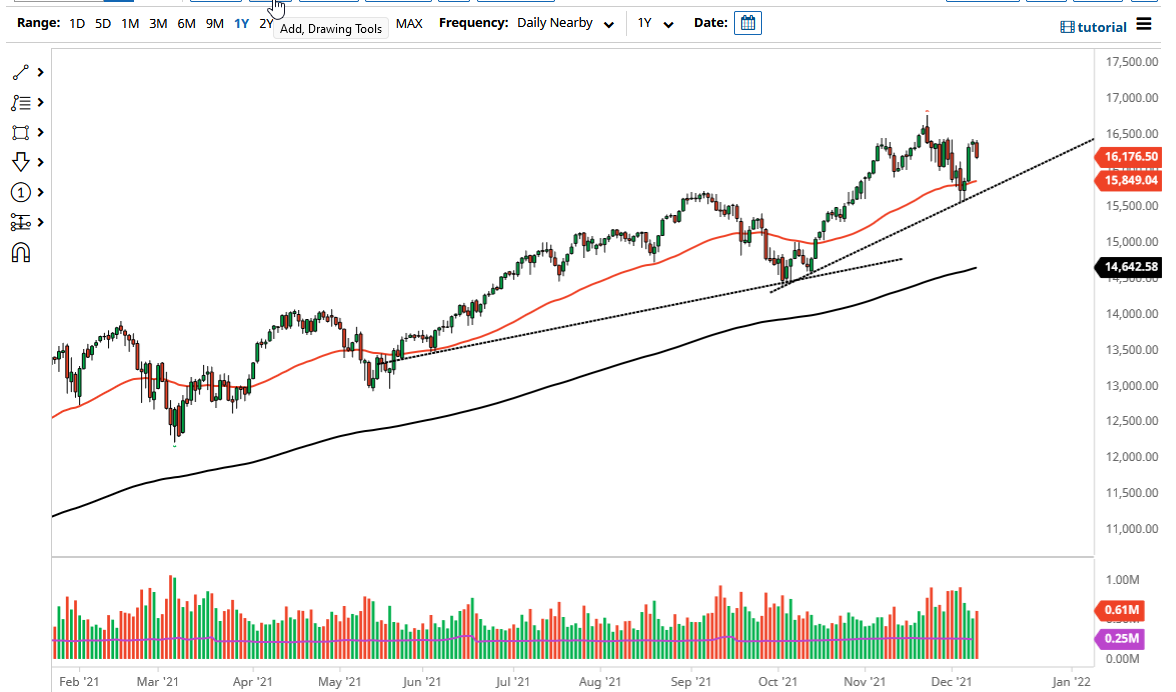
The NASDAQ has broken down a bit during the trading session on Thursday to break towards the 16,150 level. Furthermore, the market continues to see plenty of resistance near the 16,500 level, showing us just how much trouble there is in that vicinity. The NASDAQ has been underperforming as of late, and the fact that we could not break out should not be a huge surprise. I think at this point in time it is more likely than not that we will see the market may be pullback to try to find a bit of support.
The 50 day EMA sits at the 15,850 level, which is an area that had been important in the past, and of course the 50 day EMA is starting to rise a bit. We also have to pay attention to the uptrend line just underneath, which has been important since the beginning of October. The market continues to move on just a handful of stocks as per usual, including Tesla, Microsoft, and Amazon. If although stocks rally, that will send this market to the upside. On the other hand, if those stocks continue to have issues, then it is likely that we will continue to see this market fall apart.
The market continues to see a lot of noisy behavior and that will unfortunately only get worse as we head towards the end of the year. With the lack of liquidity, stock markets tend to make sudden moves as traders are closing out their books for the year. Furthermore, we also have people out there trying to chase trades in order to pick up significant gains to paid their returns for clients. If you have missed your benchmark at this point, then it is likely that we could continue to see people like that jumping in.
If we were to break down below the 15,500 level, then it is likely that we could go looking towards the 15,000 underneath and test the 200 day EMA. Whether or not this is a topping pattern is a completely different situation, but I do not think that is the case. I think we are simply looking at more volatility going forward. The 16,767.50 level is an area that people are going to have to pay close attention to, as it is the all-time high. If we can break that, the NASDAQ 100 will rip to the upside.

