The difference between success and failure in Forex trading is very likely to depend mostly upon which currency pairs you choose to trade each week and in which direction, and not on the exact trading methods you might use to determine trade entries and exits.
When starting the trading week, it is a good idea to look at the big picture of what is developing in the market as a whole and how such developments and affected by macro fundamentals and market sentiment.
There are a few long-term trends beginning to reassert themselves, so it can be a profitable time to trade the markets.
Big Picture 12th December 2021
Last week’s Forex market was very quiet leading up to Friday’s release of US inflation data, which was expected to be the key driver of market movements for the week. However, the data arrived almost completely in line with the consensus forecast, and the market did not react very strongly to it. This meant the week ended quietly with low price volatility.
Despite the long-term bullish US dollar trend, the greenback fell a little over the course of the week, and it also fell after the US inflation data were released. The inflation data showed that annualized US inflation is now increasing at a rate of 6.8%, the highest seen since 1982. However, the pace of the increase lessened, with the recent month’s increase coming in at only 0.8% compared to 0.9% in the previous month. It might be that the slight reduction in the pace of the increase is seen as significant enough to prevent more panic over inflation.
Risk sentiment improved over the week, with most stock markets higher and the benchmark US S&P 500 Index rising to approach its all-time high price. Most global stock markets rose over the week, as did the Australian and Canadian dollars which are commodity currencies and key risk barometers. The improvement in risk sentiment globally is probably mostly because there is an increasing feeling that the omicron coronavirus variant will not turn out to be as economically destructive as had been initially feared. Safe-haven currencies such as the Japanese yen, the Swiss franc, and the US dollar are all lower.
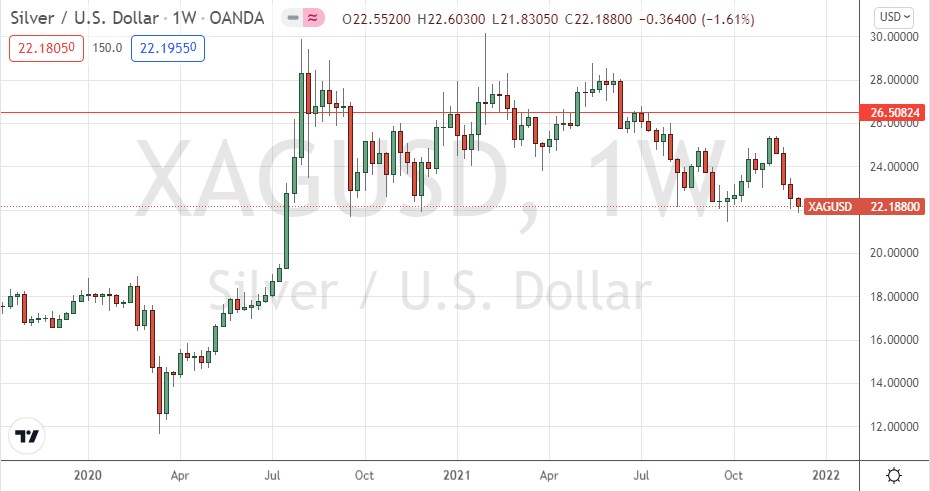
The precious metal silver fell to a new 50-day low price after falling quite strongly for several days. It bounced back a little on Friday but remains quite close to 1-year lows. Trend traders may be interested in going short on Silver.
I wrote in my previous piece last week that the best trades for the week were likely to be short of AUD/USD and NZD/USD, following daily (New York closes) at new lows. Fortunately, neither of these currency pairs made a new low at the end of any day during the week, so this was sufficient to stay out of what would have been losing trades.
Fundamental Analysis & Market Sentiment
The headline takeaways from last week were:
US CPI (inflation) data came in very slightly higher than had been expected and is now increasing at an annualized rate of 6.8%, the highest seen in 39 years. However, the pace of the monthly increase slowed slightly from 0.9% to 0.8%. Markets reacted little during the rest of Friday’s session.
A coronavirus variant of concern, named the omicron variant, has continued to spread around the world. The variant is heavily mutated, and latest studies suggest that it has a strong capacity to evade current vaccines. However, latest studies suggest that a maximal course of vaccination will still offer strong protection against severe disease.
The Reserve Banks of Australia and Canada held their respective interest rates and monetary policies steady in their monthly policy releases during the week. This probably had little impact on either currency, both of which rose firmly.
The coming week is likely to see a higher amount of volatility due to the busy economic calendar, with direction likely to be determined partly by the upcoming FOMC release and partly by how dangerous the omicron variant is shown to be as more tests are performed on it. The coming week’s major scheduled economic releases will be:
FOMC statement, federal funds rate, and economic projections.
Monthly policy releases from the European Central Bank, the Bank of England, and the Swiss National Bank.
British and Canadian CPI (inflation) data.
New Zealand GDP data.
US retail sales and PPI data.
German manufacturing and services PMI data.
Australian employment data.
Last week saw the global number of confirmed new coronavirus cases fall for the first time in seven weeks. Approximately 56% of the global population has now received at least one vaccination. Pharmaceutical industry analysts now expect a large majority of the world’s population will receive a vaccine by mid-2022.
The omicron variant has been confirmed as present in fifty-seven countries.
The strongest growths in new confirmed coronavirus cases overall right now are happening in Denmark, Finland, France, Italy, Jordan, South Korea, Laos, Luxembourg, Mali, Nigeria, Norway, Poland, Portugal, San Marino, South Africa, Sweden, Switzerland, Trinidad, and the UK.
Technical Analysis
U.S. Dollar Index
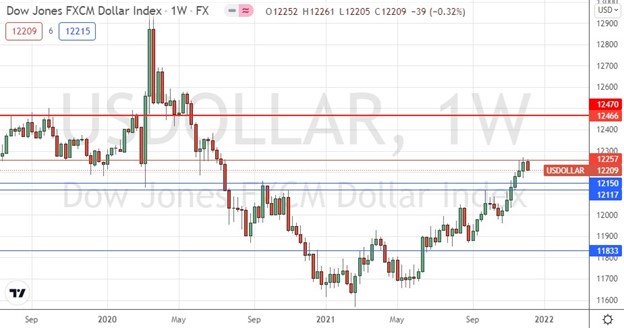
The weekly price chart below shows the U.S. Dollar Index printed a bearish inside bar last week, after making its highest weekly closing price in over one year the previous week. While one weekly candlestick of a relatively small size is not enough to invalidate a long-term trend, it is notable that there is clearly strong resistance here, which has had some impact. This suggest that despite the trend, we may be due for a bearish pullback or even a reversal. However, probability suggests this strong long-term bullish trend is likely to continue, so there is no strong reason not to be prepared to a take a long USD trade over the coming week, but do not expect bullish momentum in the USD will necessarily save you.

XAG/USD
Silver priced in US dollars made its lowest weekly close since July 2020. However, there are a few potentially supportive inflection points below the current price down to $21.45. It is also true that the pace of the bearish decline has slowed, and that Friday was an up day. Therefore, it is far from clear that silver is going to decline now with good momentum, but there does seem to be a potential for a sharp breakdown once the price gets established below $21.45.
Traders may wish to short this at the weekly open or at least once the price turns bearish over a few hours, but more cautious traders might want to wait for a daily close below $21.45 or at least $21.53.

USD/TRY
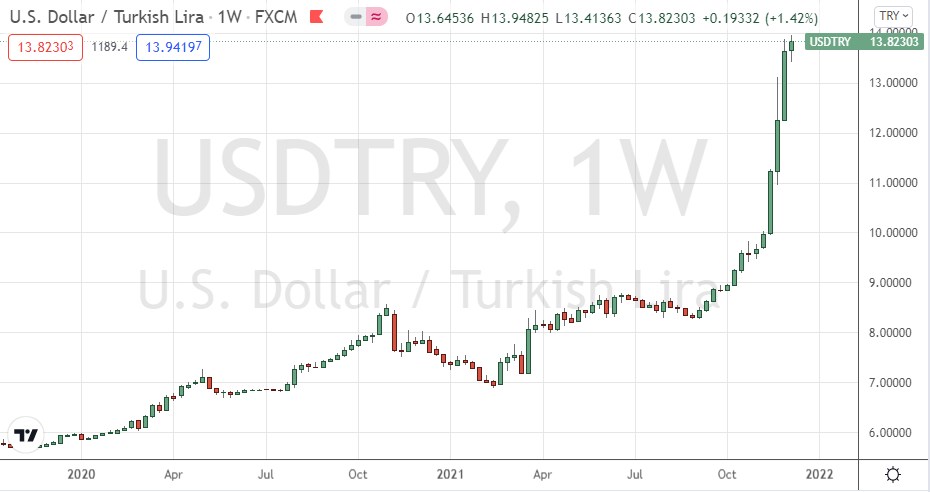
The Turkish lira has been falling very strongly and losing an enormous amount of its value. The pace of the decline slowed last week, but we again saw the lira reach a new record low against the US dollar and close at a record low too. There is a strong trend here against the lira, the problem for traders is that it is very difficult to exploit this as Forex brokers are asking for huge spreads and overnight fees on long positions. However, the odds remain strong in favor of further declines in the Turkish lira.

S&P 500 Index
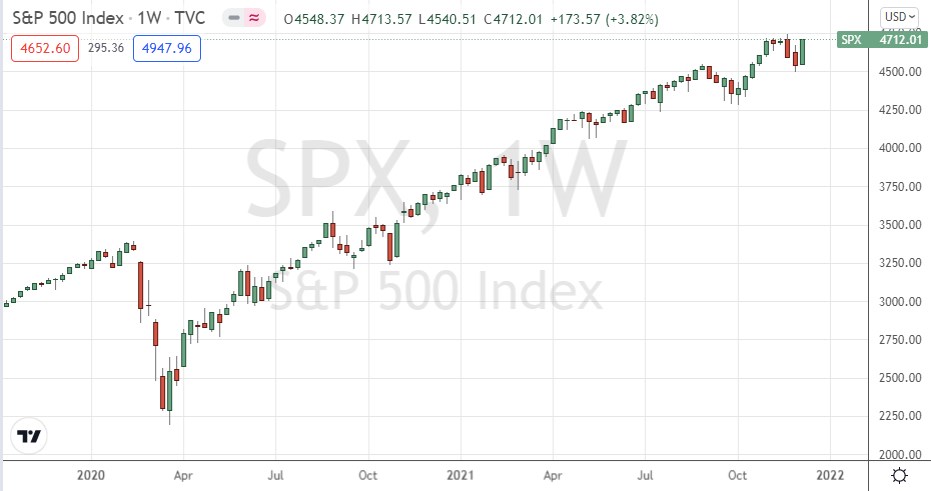
After trading below its 50-day moving average just last week, the major US stock index has risen strongly. Although the price did not trade yet at a new all-time high, the index made its highest ever daily close on Friday.
The weekly candlestick was solidly bullish and closed extremely close to the top of its price range. This, and the record high close, are bullish signs.
The S&P 500 Index looks likely to remain a good potential buy in the current “risk off” market environment, provided we get no nasty surprises from the omicron coronavirus variant.

Bottom Line
I see the best opportunities in the financial markets this week as likely to be long of the S&P 500 Index and short of Silver in US Dollar terms following a daily (New York) close below $21.45.
