Bullish View
Buy the BTC/USD and set a take-profit at 53,400.
Add a stop-loss at 48,000.
Timeline: 2 days.
Bearish View
Set a sell-stop at 48,000 and add a take-profit at 46,000.
Add a stop-loss at 50,000.
The BTC/USD pair bounced back in the overnight session as market sentiment improved. The pair rose to a high of 50,755, which is about 20% above the lowest level during the weekend. Still, the price is about $18,000 below its all time high.
BTC Bounces Back
The BTC/USD pair declined sharply during the weekend. At its worst, the coin dropped to a low of 42,000, which was the lowest level in several months.
There were several reasons for this crash. First, the market was reacting to the relatively hawkish statement by the Federal Reserve chair last week. In it, Jerome Powell said that the central bank was considering intensifying the tapering of its asset purchases in the next meeting. The FOMC will hold its final meeting of the year next week.
Ideally, a hawkish tone by the Federal Reserve is usually seen as being a bullish sign for the US dollar and bearish for risky assets like Bitcoin and tech stocks. Indeed, the weekend crash happened after the tech-heavy Nasdaq 100 index declined by more than 300 points on Friday.
The BTC/USD also declined because of the liquidation of leveraged bets considering that the price has declined in the past few weeks.
Leveraged derivatives in the BTC market have become relatively popular since they help traders to amplify their profits. Therefore, in case of a drop, there is usually a liquidation as the margin call is triggered. During the weekend, analysts experienced substantial closing of these bets.
Bitcoin rebounded during the overnight session as sentiment in the market improved. Indeed, US stocks also surged, with the Nasdaq 100 index rose by more than 140 points while the Dow Jones rose by more than 645 points.
BTC/USD Forecast
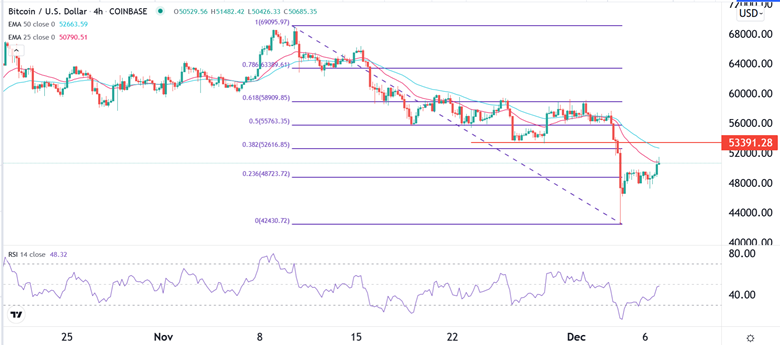
The four-hour chart shows that the BTC/USD pair has bounced back in the past two sessions. It has managed to move above the 23.6% Fibonacci retracement level. At the same time, it has invalidated the bearish flag pattern that formed on Monday. The pair has also crossed the 25-day moving average. The Relative Strength Index and other oscillators have moved from the oversold level.
Therefore, the pair will likely continue the recovery as bulls target the key resistance level at 53,390, which was the lowest level on November 29th. Still, a drop below the key support level at about 48,000 will invalidate the bullish view.

