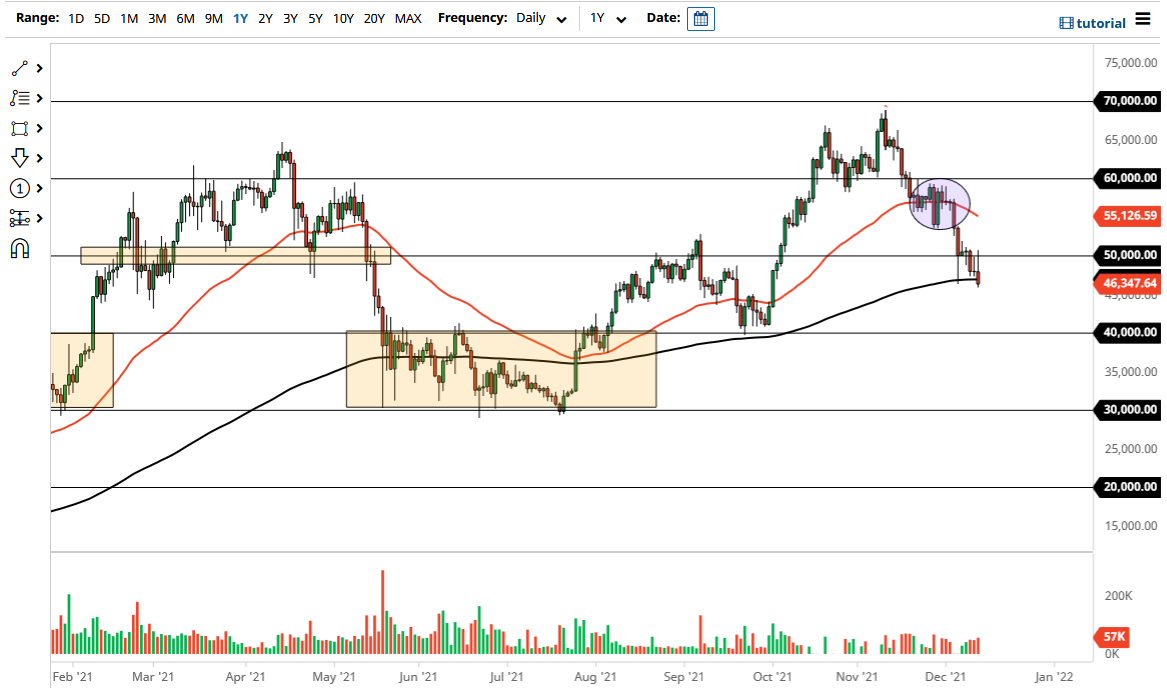
The Bitcoin market initially poked above the $50,000 level to kick off Monday, but then got hammered to reach down towards the 200-day EMA. The question at this point is whether or not the 200 day EMA can continue to offer support. At this point in time, we are forming a bit of an inverted hammer, so it is going to be now or never, I suspect. A breakdown below the bottom of the candlestick would of course be a very ugly turn of events, perhaps opening up the possibility of a move down to the $40,000 level.
All of this being said, if you have traded Bitcoin for any length of time, none of this is new. This is an extraordinarily volatile asset, and the recent selloff is par for the course. A breakdown to the $40,000 level would almost certainly attract value hunters, because remember: 80% of people who have bought Bitcoin have never sold it. In other words, it is not a market that tends to stay bearish for very long, although there were a couple of years of nothingness after the last major breakdown. Regardless, it has been much more widely adopted by institutions over the last couple of years to suspect that we will get another three-year sideways move after a flush. More likely than not, we will have plenty of buyers underneath to take advantage of this along the way.
Unfortunately, Bitcoin has been one of the better performers for some of these larger funds that are now involved with it. While that in and of itself is not a bad thing, what does make for a hard time is that sometimes they have to sell their position in order to cover losses in other markets. It is possible that that is what is going on here, although I cannot speak for them.
$51,000 above being broken to the upside would be a very good sign, and at that point in time I think you would probably get a lot more buying pressure. On the other hand, if we do get that breakdown below the bottom of the candlestick for the trading session, we could very well crash towards the $40,000 level rather quickly. Longer term, there is nothing on this chart that suggests Bitcoin cannot turn right back around, because nothing has changed.

