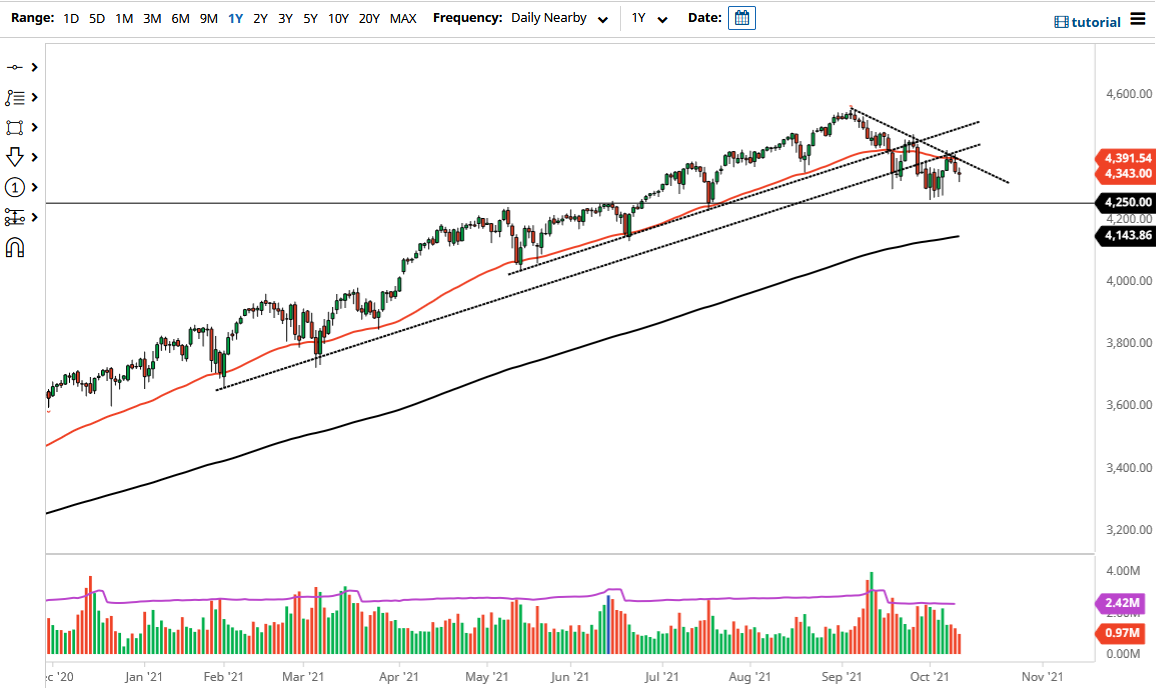
The S&P 500 pulled back just a bit on Tuesday, but then turned around to show signs of life again in order to form a hammer. If we can break above the top of that hammer, then we have some work to do in order to get long again. The 50-day EMA above is starting to reach lower, and it looks like we are seeing the 50-day EMA walks right along a downtrend line as well. In other words, it would make sense that we could see selling pressure. If we can break above that downtrend line though, that would obviously be a very bullish sign.
The S&P 500 has a huge area just underneath that has a lot of order flow, with the 4250 level underneath offering significant support. In fact, if we were to break down below there, then I would be a buyer of puts as it could open up a bigger move to the downside. That is an area that has been very important as of late though, so I would anticipate that there should be plenty of buyers. In fact, we dipped into the trading region just above there and turned around so it could be the beginning of something a little bit more constructive.
The US dollar could have its effect as well, because if the US dollar starts to skyrocket, sometimes that works against the value of stock markets. We are still very much in an uptrend but have been very choppy for a while. Because of this, I think we have a little bit of work to do in order to build up any type of momentum, and the next couple of days could be rather difficult. That does not mean that anything has changed, other than the fact that we may need to do a little bit of work. Because of this, do not get involved with a huge position, and only build up that position once the market starts to work out in your favor. The overall attitude of the market is higher over the longer term, and I think that is what we will eventually see. Adding more credence to the 4250 level is the fact that the 200-day EMA is starting to reach towards that area.

