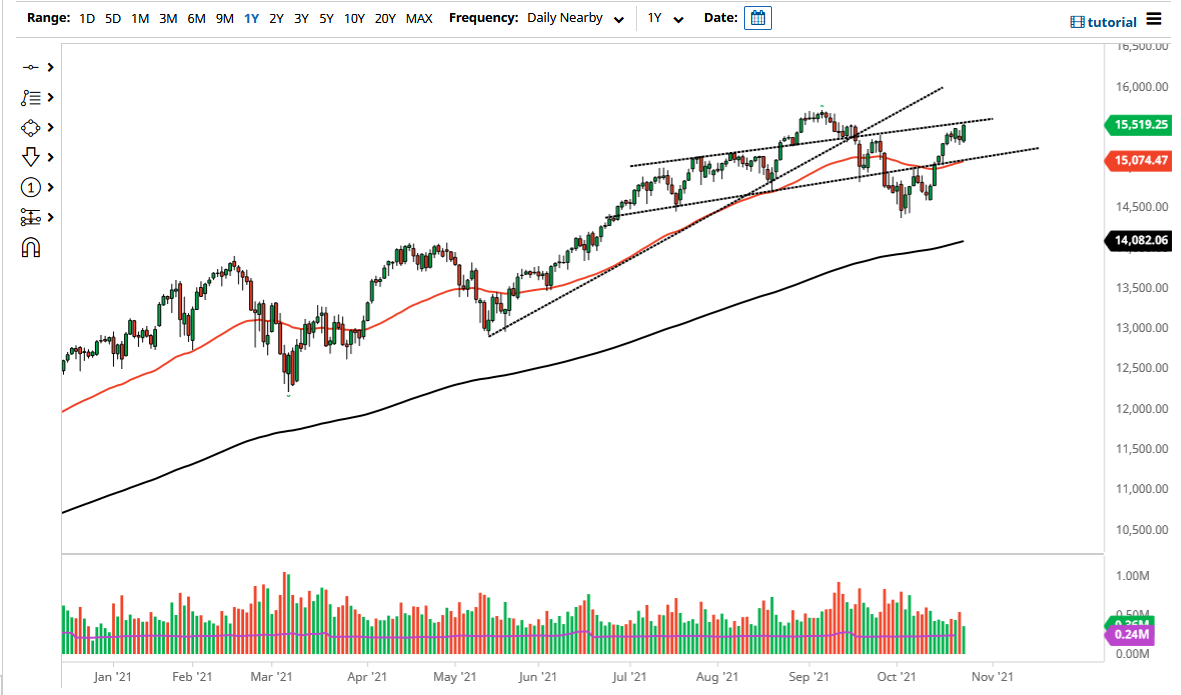
The NASDAQ 100 has rallied significantly during the course of the trading session on Monday, reaching towards the 15,500 region. This is an area that traders will pay close attention to due to the fact that the NASDAQ 100 does tend to have a certain reaction every 500 points or so. The size of the candlestick is bigger than the last several days, so therefore I think it makes quite a bit of sense that we would see a certain amount of follow-through at this point. Stocks look good in general, and as we are in the midst of earnings season, it is very likely that we will continue to see traders chase profits.
To the downside, if we break down below the lows of the last couple of days, then it is possible that the market goes looking towards the 50 day EMA. The 50 day EMA attracts a certain amount of attention from technical traders, and therefore I think you would be seeing a scenario where value hunters would come back into the picture. When you look at this chart, we have formed a massive “W pattern”, which of course is a bullish sign, and therefore it is only a matter of time before we go and break the all-time highs. If we do, then the market will be looking at the 16,000 level as a potential target.
The NASDAQ 100 of course is highly driven by just a handful of stocks, and therefore you need to pay attention to the usual suspect such as Facebook, Microsoft, and Tesla. As the market is so heavily weighted to just a handful of stocks, if they rally, so does the index. With that being the case, I think it is only a matter of time before we would see a move to the upside as the stocks always seemed to rise over the longer term. If we were to break down below the 50 day EMA, then it is likely that we could go looking towards the 14,500 level. That is an area where I would be a buyer of puts if we break down below it, but it certainly does not look likely to happen anytime soon. With this, I think you continue to buy dips overall and look to the upside when it comes to the NASDAQ 100 and the stock market in general.

