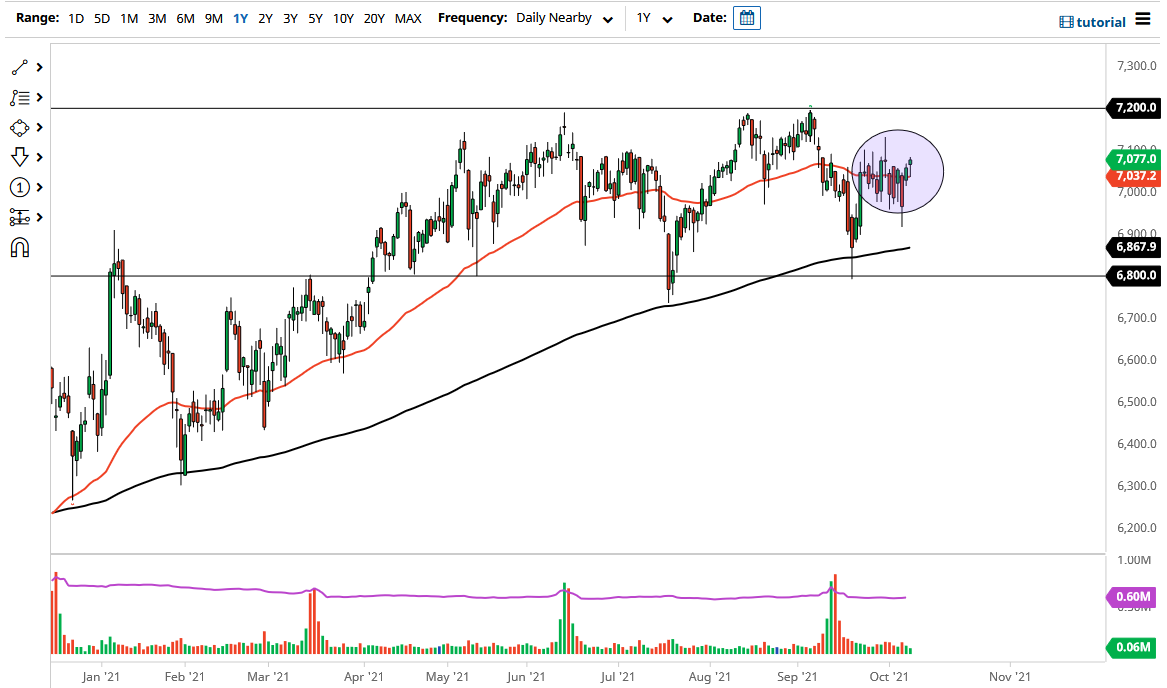
The FTSE 100 initially gapped ever so slightly to the upside on Friday but then turned around to fall towards the 50-day EMA. The 50-day EMA is sideways at this point, so it will be interesting to see whether or not we can continue the momentum that caused the market to turn around and rally to form a bit of a hammer.
If we can break above the top of the hammer, then it is likely that the market will go looking towards the 7100 level, possibly even the 7200 level. The 7200 level is an area that a lot of people have had to pay close attention to, as it is the top of the overall consolidation region. The 6800 level underneath is the floor, and although we are trying to break to the upside, it should be noted that we are closer to the middle than anything else.
Notice that the purple circle on the chart shows a lot of consolidation, and it does show that we are trying to build up some type of momentum. At this point, if we break above the 7100 level then it does make sense that we will go looking towards the 7200 level, which could possibly open up either a reversal trade, or on a daily close above that level, a move for a “buy-and-hold” situation.
Keep in mind that the FTSE 100 is highly sensitive to things going on in the United Kingdom, but the market also gets influenced by the global growth situation, which does not look that hard. Yes, we may continue to grow, but the easy growth from the pandemic has already been had. In other words, even if we do rally from here, it is unlikely that we will see an easy move to the upside. At this point it is likely that you will see more of a “backfilling” of every pullback that we get. The short-term market continues to be a “buy on the dips” type of situation, but based upon short-term charts more than anything else. If we do break down below the 6900 level, then I think that we will go looking towards at least the 200-day EMA underneath, if not the previously mentioned 6800 level.

