The difference between success and failure in Forex trading is very likely to depend mostly upon which currency pairs you choose to trade each week and in which direction, and not on the exact trading methods you might use to determine trade entries and exits.
When starting the trading week, it is a good idea to look at the big picture of what is developing in the market as a whole and how such developments and affected by macro fundamentals and market sentiment.
There are a few strong valid long-term trends in the market right now, so it is a good time to be trading to take advantage of that.
Big Picture 31st October 2021
Last week’s Forex market moved weakly in line with the long-term bullish USD trend but did not offer many good opportunities despite the unusually large amount of central bank activity. There was better activity in stocks and commodities. WTI Crude Oil reached a new 7-year high on Monday before falling back. The S&P 500 stock market index closed at an all-time high on Friday above 4600. The Australian dollar was the strongest major currency over the past week while the euro was the weakest.
I wrote in my previous piece last week that the best trades were long of WTI Crude Oil and the S&P 500 Index in US Dollar terms, and long USD/TRY. WTI Crude Oil fell by 1.03% while the S&P 500 Index rose by 1.14% and the USD/TRY fell by 0.08%. This produced an average profit of 0.01%.
Fundamental Analysis & Market Sentiment
The headline takeaways from last week were:
- Lower than expected US GDP and higher than expected Eurozone inflation, with the latter hitting the relative value of the euro hard on Friday when the data was released. Eurozone inflation is now running at an annualized rate of 4.1%, higher than the 3.7% which had been expected and a 13-year high. Eurozone growth is also higher than expected. The inflationary pressure is already causing considerable disquiet in Germany.
- US Advance GDP came in at 2.0% undershooting the widely anticipated value of 2.6%. However, the US stock market continued to advance to a record high price.
- In addition to the European Central Bank, the Banks of Japan and Canada also made monthly policy releases last week. The Bank of Japan lowered its growth forecast which weighed on the yen. The Bank of Canada unexpectedly announced tighter monetary policy with the end of its bond purchase program and a signal of willingness to raise rates in the near term, which hit the Canadian stock market (as did the weaker than expected Canadian GDP release) while firming up the Canadian dollar.
- WTI Crude Oil remains quite firm but is off its highs and broke sideways out of its strong bullish price channel. Markets still seem quite bullish on crude oil with no major additions to supply in sight.
The Forex market has seen a small resurgence in the US dollar in line with the long-term bullish dollar trend, but action was surprisingly dominated by currency crosses. The post-corona “reflation trade” remains valid but has weakened.
The coming week is also likely to see a very active market, with several major events scheduled: monthly policy releases are due from the Federal Reserve, the Bank of England, and the Reserve Bank of Australia. There will also be a non-farm payrolls data release at the end of the week.
Last week saw the global number of confirmed new coronavirus cases rise for the second consecutive week after having fallen for two months, with deaths also higher for the first week in two months. Approximately 49.3% of the global population has now received at least one vaccination. Pharmaceutical industry analysts now expect a large majority of the world’s population will receive a vaccine by mid-2022.
The strongest growths in new confirmed coronavirus cases right now are happening in Armenia, Austria, Azerbaijan, Barbados, Belarus, Belgium, Bosnia, Bulgaria, Chile, Croatia, Czech Republic, Denmark, Egypt, Estonia, Finland, Germany, Greece, Hungary, Iceland, Laos, Latvia, Lithuania, Montenegro, Netherlands, New Zealand, Norway, Poland, Russia, Singapore, Slovakia, Slovenia, and the Ukraine.
Technical Analysis
U.S. Dollar Index
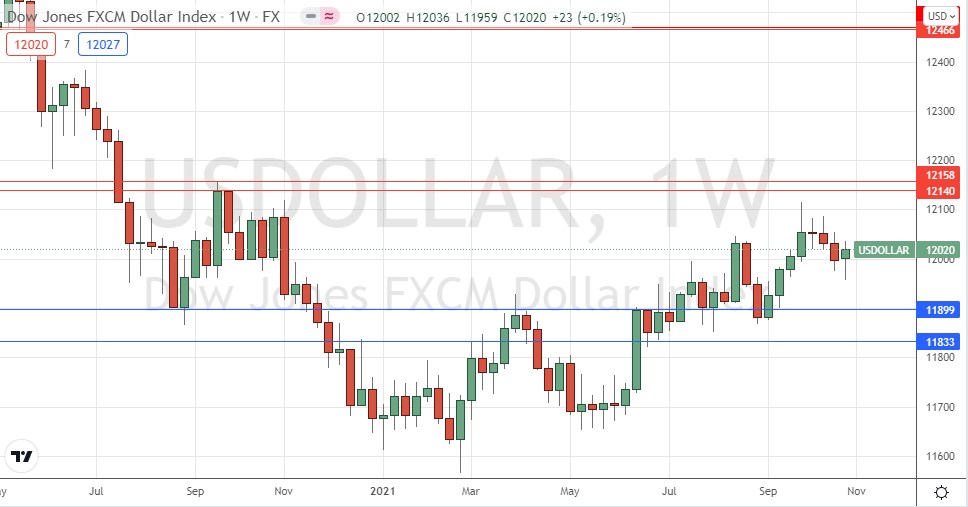
The weekly price chart below shows the U.S. Dollar Index printed a bullish pin bar last week. The price is showing weak short-term bullish momentum, and the price is above its levels from 3 and 6 months ago, which shows that the long-term bullish trend in the greenback is still valid. The best strategy in the Forex market over the coming week will probably be to look for long trades in stocks or commodities, or in long USD Forex trades.
EUR/USD
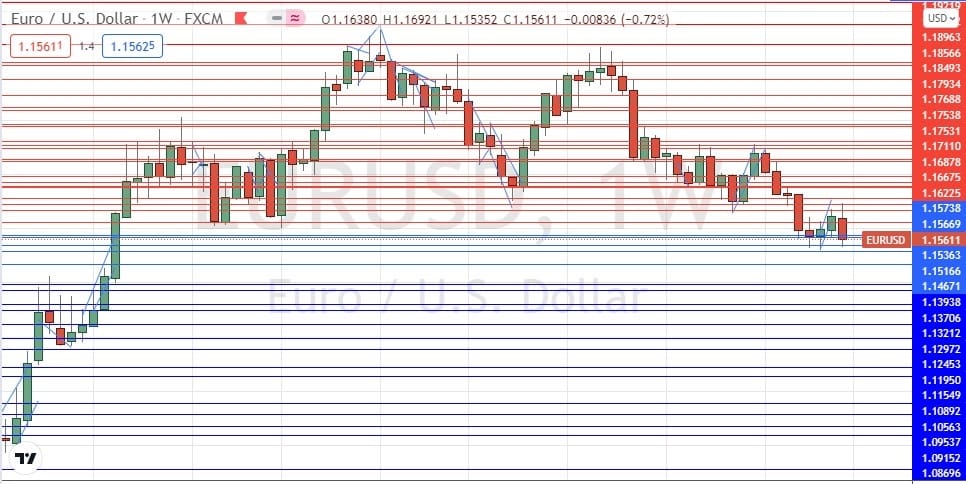
This major currency pair has been in a long-term bearish trend but with deep bullish retracements, making it difficult to trade. Last week, we saw the lowest weekly close here made in the last 15 months.
Friday saw the price drop by an unusually large amount as surprisingly high Eurozone inflation data was released – the day’s move was almost three times as large as the short-term average true range. It is therefore likely we will see a downwards price move over the course of Monday. If Monday then closes below 1.1530 – or ideally, below 1.1500 – we will probably see yet more downwards price movement, so there is likely to be a short trade opportunity here if this scenario plays out.
Traders do need to be careful to only trade short when the short-term momentum is bearish. At Friday’s close, it was bullish instead.
WTI Crude Oil
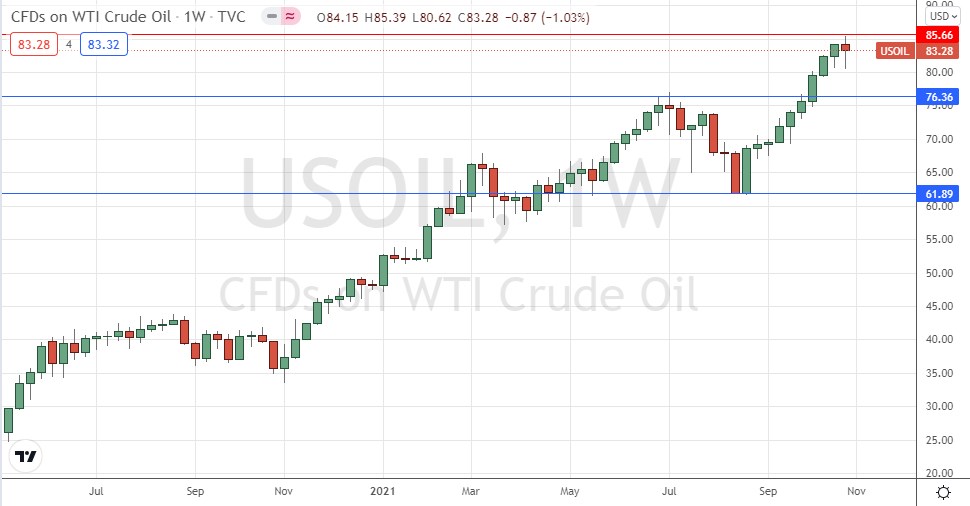
Last week saw crude oil print another new 7-year high price before pulling back. Although we have a bearish retracement which broke the rhythm of the rise, we have only one weakly bearish candlestick which looks a little like a bullish pin bar, so there is a good chance that the strong rise in crude oil will continue soon. However, the price has been held down by the resistance level shown in the price chart below at $65.66 which may be hard to break.
USD/TRY
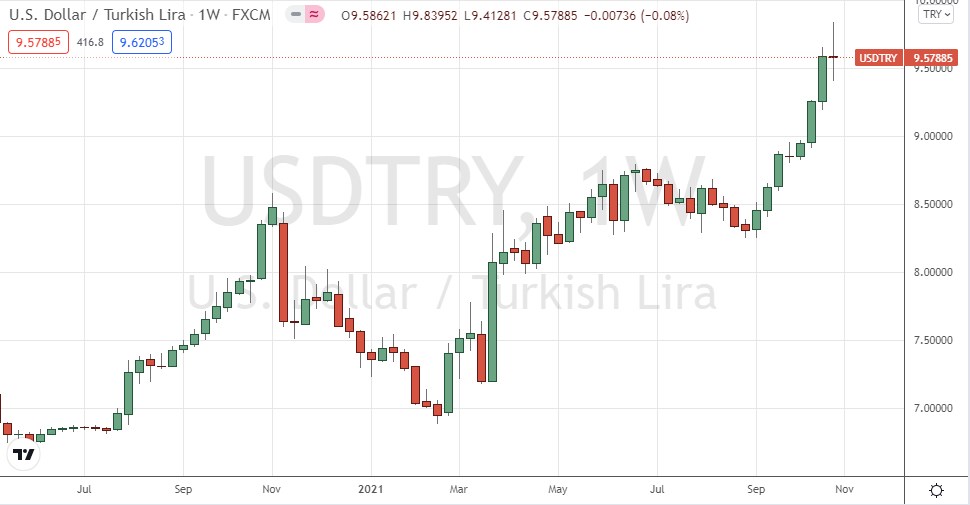
The price made a new all-time high last week but then the lira recovered, with the week ending as an indecisive doji. This could signal the rise is over for at least a while. The story here is about the never-ending depreciation of the Turkish lira which is due partially to the fact that the Turkish central bank is subject to political interference from the presidency which has a very controversial view of monetary policy, and partially due to ongoing structural problems in the Turkish economy.
It can be difficult to trade the Turkish lira as spreads are wide and overnight financing fees (swaps) very high. However, the persistence of the short Turkish lira trend over many years can make it an attractive trade.
S&P 500 Index
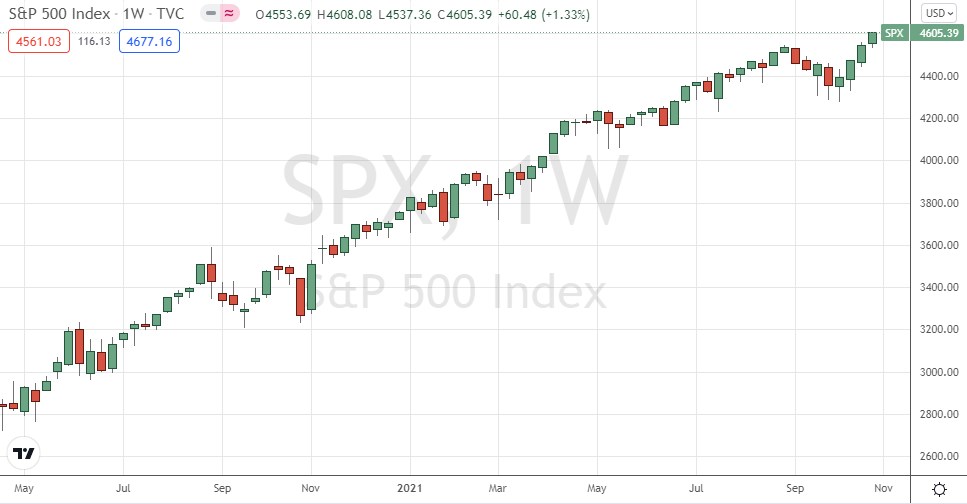
After trading below its 100-day moving average just a few weeks ago, the major US stock index has been roaring ahead for the past four weeks, rising in value during this time by about 8%. The end of last week saw the price reach another new all-time high, closing above the round number at 4600 for the first time.
The weekly candlestick was solidly bullish and closed near the top of its price range. This, and the record high, are bullish signs.
The S&P 500 Index looks likely to remain a good potential buy in the current “risk off” market environment.
Bottom Line
I see the best opportunities in the financial markets this week as likely to be long of the S&P 500 Index in US dollar terms, and long USD/TRY and/or WTI Crude Oil when a new long-term high daily closing price is made, and short EUR/USD on Monday and then continuing if Monday’s daily (New York) close is below 1.1530.
