The difference between success and failure in Forex trading is very likely to depend mostly upon which currency pairs you choose to trade each week and in which direction, and not on the exact trading methods you might use to determine trade entries and exits.
When starting the trading week, it is a good idea to look at the big picture of what is developing in the market as a whole and how such developments and affected by macro fundamentals and market sentiment.
There are a some strong valid long-term trends in the market right now, so it is a good time to be trading to take advantage of that.
Big Picture 24th October 2021
Last week’s Forex market moved mostly counter-trend and did not offer many good opportunities. WTI Crude Oil again moved firmly higher to a new multi-year high price, while Bitcoin and the S&P 500 stock market index both reached all-time highs. The New Zealand dollar was the strongest major currency over the past week while the British pound was the weakest.
I wrote in my previous piece last week that the best trades were likely to be long of WTI Crude Oil in US dollar terms, and long USD/JPY and USD/TRY. WTI Crude Oil rose by 2.04% while USD/TRY rose by 3.57%, although the USD/JPY fell by 0.64%. This produced an averaged win of 1.66%.
Fundamental Analysis & Market Sentiment
The headline takeaways from last week were the continuing rise in the price of crude oil in the face of increasing demand and continuing supply chain problems, and lower than expected British CPI (inflation) data showing an annualized rate of 3.1%. Markets remained in “risk on” mode regarding most stock markets which rose over the week, as did Bitcoin and WTI crude oil which hit fresh highs. However, the Forex market became less confused and directed, with most currencies moving counter trend over the past week. The post-corona “reflation trade” remains valid but has weakened.
The coming week should be much more active than last week, with several major events scheduled: monthly policy releases are due from the ECB, the Bank of Japan, and the Bank of Canada, and there will also be a release of US advance GDP data.
Last week saw the global number of confirmed new coronavirus cases rise for the first week in two months, with deaths lower for the eight consecutive week. Approximately 48.4% of the global population has now received at least one vaccination. Industry analysts now expect a large majority of the world’s population will receive a vaccine by mid-2022.
The strongest growths in new confirmed coronavirus cases right now are happening in Armenia, Austria, Azerbaijan, the Bahamas, Barbados, Belarus, Belgium, Bulgaria, Chile, Croatia, Denmark, Dominican Republic, Egypt, Estonia, Georgia, Germany, Greece, Iceland, Latvia, Lithuania, Moldova, Netherlands, New Zealand, Romania, Russia, Serbia, Singapore, Slovakia, Slovenia, the United Kingdom, and the Ukraine.
Technical Analysis
U.S. Dollar Index
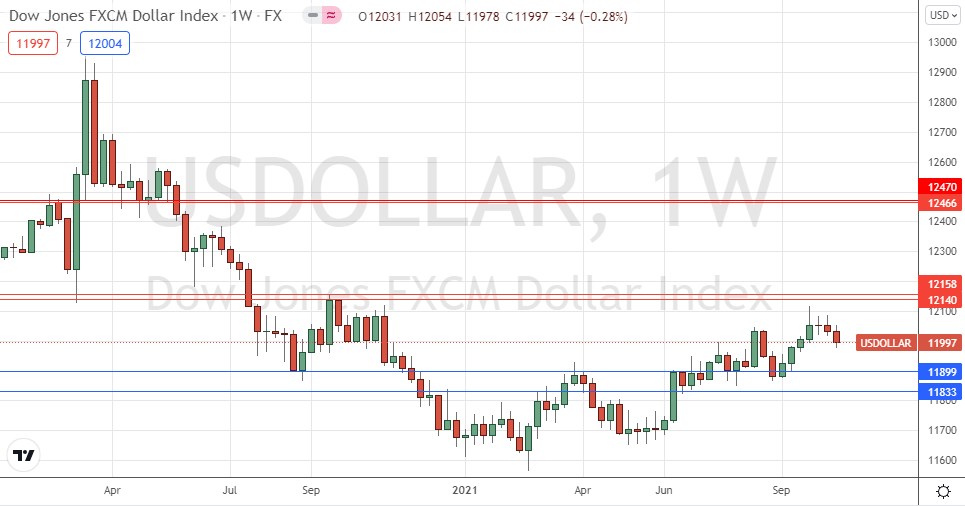
The weekly price chart below shows the U.S. Dollar Index printed a bearish candlestick last week after recently rejecting an area near the zone of resistance which I had identified between 12140 and 12158, shown in the price chart below. Despite the short-term bearish momentum, the price is above the levels from 3 and 6 months ago, which shows that the long-term bullish trend in the greenback is still valid. However, the short-term momentum is bearish. This suggests that the USD outlook right now is a little uncertain, so the best strategy in the Forex market over the coming week will probably be to look for long trades in stocks or commodities, or in Forex in other strong currencies and short trades in relatively weak currencies.

WTI Crude Oil
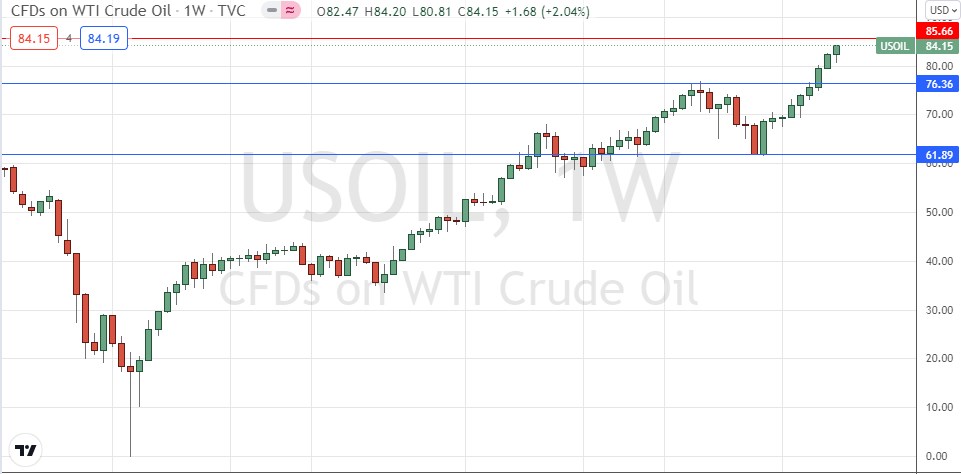
WTI Crude Oil closed Friday for the second consecutive week at a new 7-year high weekly closing price after closing strongly up over several previous weeks. This is a very bullish sign. The price is likely to continue rising over the short term as the global energy supply crisis continues. Bulls should be aware of the potential resistance level shown in the price chart below at $84.66.

USD/TRY
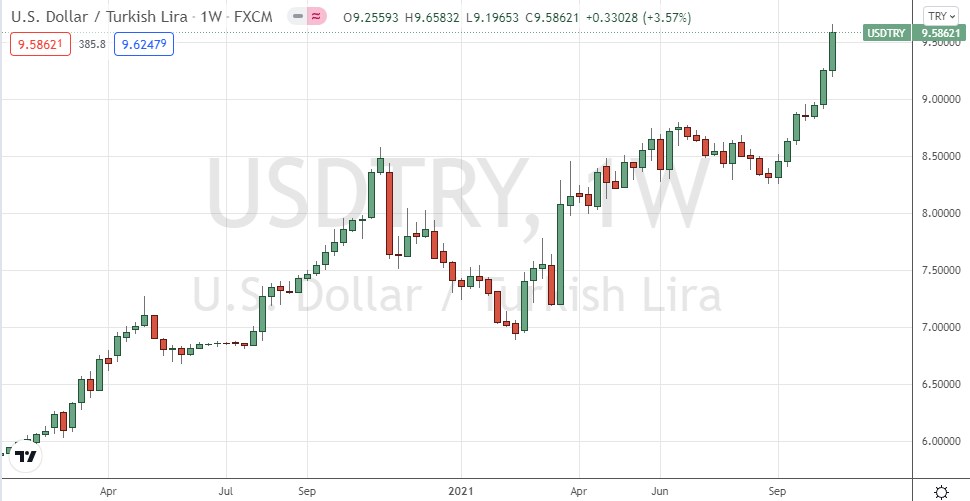
The price has been breaking to new record highs for the past three weeks and rose very strongly last week to break to new highs again well above 9.25. The story here is about the seemingly never-ending depreciation of the Turkish Lira which is due partially to the fact that the Turkish central bank is subject to political interference from the presidency which has a very controversial view of monetary policy, and partially due to ongoing structural problems in the Turkish economy. Turkey’s announced intended expulsion of U.S. diplomats is unlikely to help the currency this week.
It can be difficult to trade the Turkish lira as spreads are wide and overnight financing fees (swaps) very high. However, the persistence of the short Turkish lira trend over the years makes it an attractive trade.

S&P 500 Index
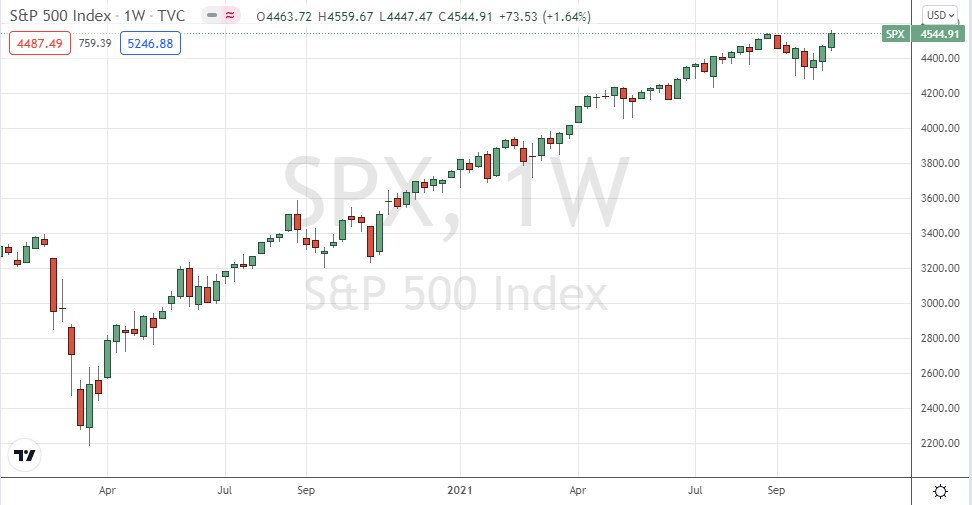
After trading below its 100-day moving average just a few weeks ago, the major US stock index has been roaring ahead for the past three week, rising in value during this time by about 5%. The end of last week saw the price reach a new all-time high above the previous record set last September.
The weekly candlestick was solidly bullish and closed near the top of its price range. This, and the record high, are bullish signs.
The S&P 500 Index looks likely to remain a good potential buy in the current “risk off” market environment.

Bottom Line
I see the best opportunities in the financial markets this week as likely to be long of WTI Crude Oil and the S&P 500 Index in US Dollar terms, and long USD/TRY.
