Bullish View
Buy the BTC/USD and set a take-profit at 52,000.
Add a stop-loss at 46,000.
Timeline: 2 days.
Bearish View
Set a sell-stop at 46,650 and a take-profit at 44,000.
Add a stop-loss at 48,000.
The BTC/USD held steady in the overnight session even as US bond yields rose and stocks retreated. Bitcoin is trading at $48,660, which is slightly below the weekend high of $49,286. It has a total market capitalization of more than $912 billion while the combined cap of all cryptocurrencies tracked by CoinMarketCap has jumped to more than $2.1 trillion.
Bitcoin Rebounds
The BTC/USD rallied during the weekend as demand rose steadily. On Sunday, the pair rose to a high of more than $49,000 and then rebounded on Monday. In the overnight session, the price rebounded even as the macro situation worsened.
In the US, the ten-year bond yield rose to 1.477% while the Dow Jones lost more than 400 points. The S&P 500 and NASDAQ 100 indices declined by more than 67 and 360 points, respectively. In most periods, Bitcoin tends to have a close correlation with American stocks.
This growth was likely because of the strong inflows into Bitcoin. According to Glassnode, Bitcoin recorded more than $1.75 billion worth of inflows every day. Most of these inflows have been among investors buying more than $10 million worth of Bitcoin every day.
At the same time, activity among Bitcoin miners has continued rising. Protocol mining difficulty rose by 39% after bottoming in July after China announced a crackdown. The mining difficulty is currently at levels not seen since 2020. This growth has pushed hash rates to significant levels.
The profitability among miners has also increased substantially in the past few weeks. Therefore, this is a sign that activity within the chain has jumped substantially recently.
Meanwhile, the BTC/USD rose as the US Dollar Index declined as well. The US Dollar Index crashed by more than 0.26% in the overnight session.
BTC/USD Forecast
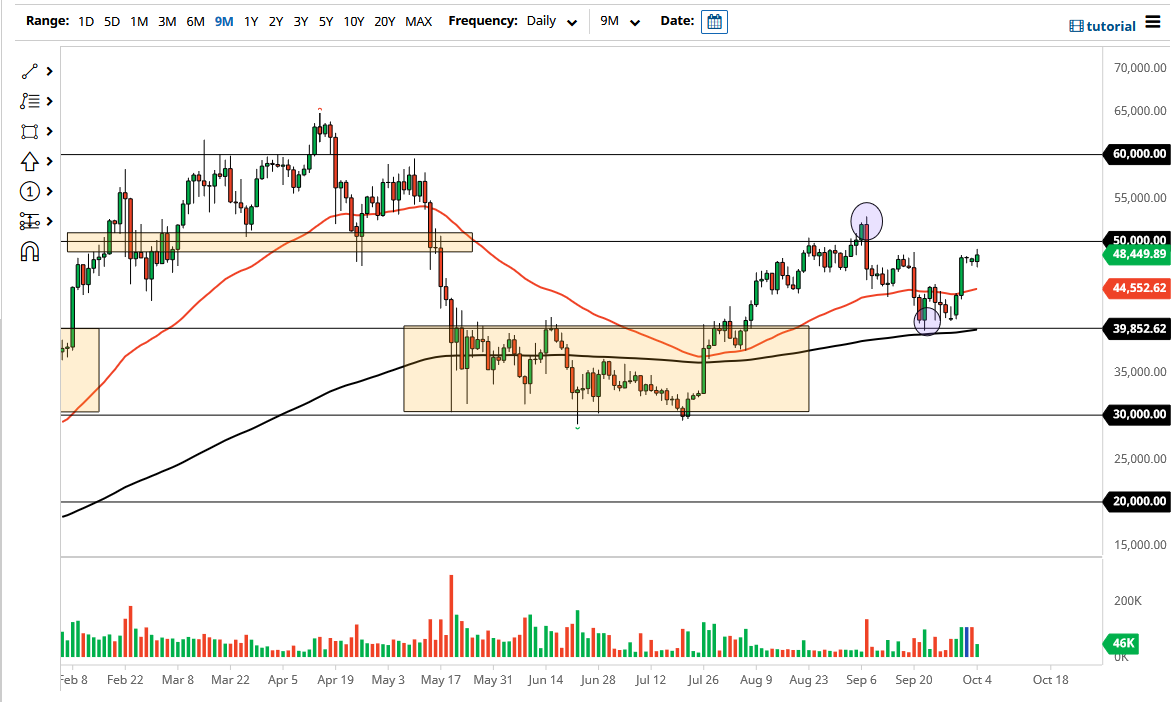
The four-hour chart shows that the BTC/USD has formed a bullish flag pattern. In technical analysis, a bullish flag pattern is usually a bullish sign. The price is also being supported by the 25-day and 50-day moving averages.
It is also along an important resistance level since it struggled to move above this level several times in September. Therefore, the BTC/USD will likely keep rising as bulls target the key resistance level at 52,000. This view will be invalidated if the price moves below the key support at 45,197.

