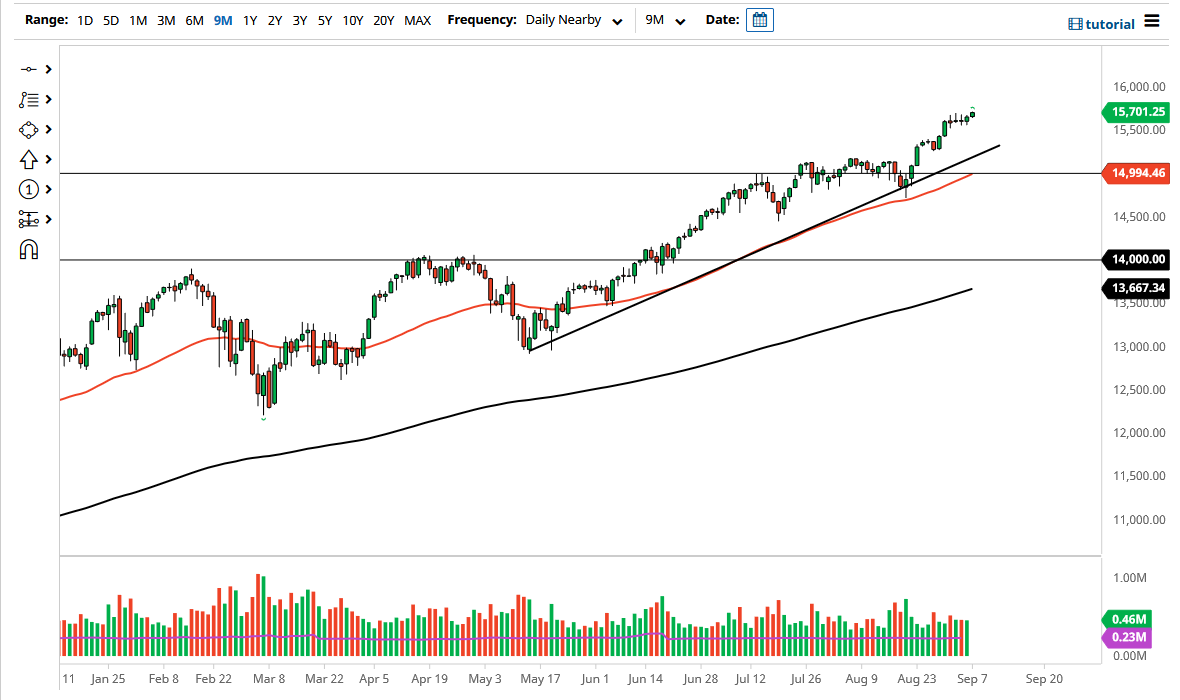
The NASDAQ 100 has rallied a bit during the trading session on Monday to show signs of life, despite the fact that Americans were even at work. The futures market had limited electronic trading for the session though, as we had seen a bit of a continuation of the movement to the upside that we had seen on Friday. With this, the market closed just above the 15,700 level, and therefore open up the possibility of moving towards the 15,750 level.
Pullbacks at this point in time should continue to see a certain amount of support down at the 15,500 level, and therefore I think what we are looking at here is a simple “buy on the dips” type of situation. That has been the case for the last 13 years, so I do not necessarily think that the market is going to change anytime soon. Dips continue to be opportunities to pick up value, especially as the Federal Reserve is light years away from doing anything remotely close to the idea of tightening. Yes, they may taper bond purchases, but that is about as aggressive as they will get. Jerome Powell specifically stated that interest rates would not be rising.
The fact that Jerome Powell has explicitly said that interest rates are going to be rising bodes well for the NASDAQ 100 as a lot of the “growth companies” attract money in a low interest-rate environment. This includes all of the usual suspect such as Facebook, Amazon, Alphabet, Tesla, and all of the other “Wall Street darlings” that make up a bulk of what moves this index. In other words, it is very difficult that this market breaks down for any significant amount of time, and therefore I think that the uptrend line underneath should continue to offer plenty of support, right along with the 50 day EMA which is currently sitting at the 15,000 level.
If we were to break down below all of that, then I might be a buyer of puts, but that is about as negative as I get when it comes to US indices as they are so highly supported by the central bank. Furthermore, this is a scenario where Wall Street tends to find some type of narrative go long regardless. This is a market that will ultimately go higher and looking towards the 16,000 level from everything I see on this chart.