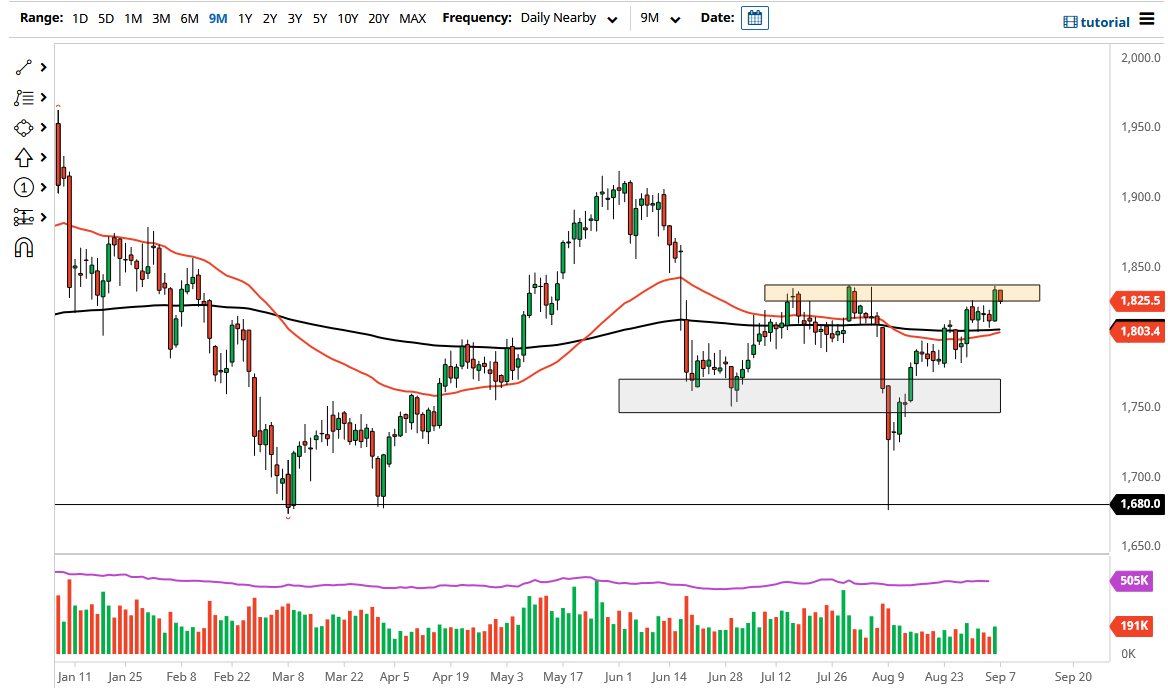
The gold market has pulled back a bit during the trading session on Monday from a major resistance barrier in the form of $1835. That is a gateway to much higher pricing, and quite frankly the way that we ended up forming such a massive candlestick on Friday, one would think that we could see that happen. However, the short-term pullback does make a certain amount of sense because there would have been a major lack of volume during the Monday session as the United States and Canada both were away at Labor Day celebrations.
When you look at this chart, the first thing that you should notice is that both the 50 day EMA and the 200 day EMA indicators are sitting right at $1800, an area that has a certain amount of psychological importance attached to it. Because of this, I think it is only a matter of time before buyers will return on a pullback to that area, not only due to the indicators, but of course the psychological importance of the $1800 level. Beyond that, you should also keep in mind that the US dollar has a lot to do with what happens next, so make sure that you are paying attention to the US Dollar Index.
As a general rule, if the US Dollar Index falls, that is generally good for gold. It is obviously the same in the other direction, so all things being equal you should always have an eye on that chart. The strengthening US dollar works against gold typically due to rising interest rates on the 10 year note, making owning those greenbacks much more desirable. On the other hand, if we see a lot of US dollar selling, that might be enough to push gold through the $1835 level as it is such a propellant for the market. At that point, I would anticipate that the gold market goes looking towards the $1900 region, although it may take a while to get there.
As you can see, we are almost certainly banging on the resistance barrier that is either going to give way, or it is going to prove to be yet again far too strong to overcome. I think the next couple of candlestick should give us an idea as to where we go for a longer-term move. Stay tuned here at Daily Forex, I will let you know what I see.

