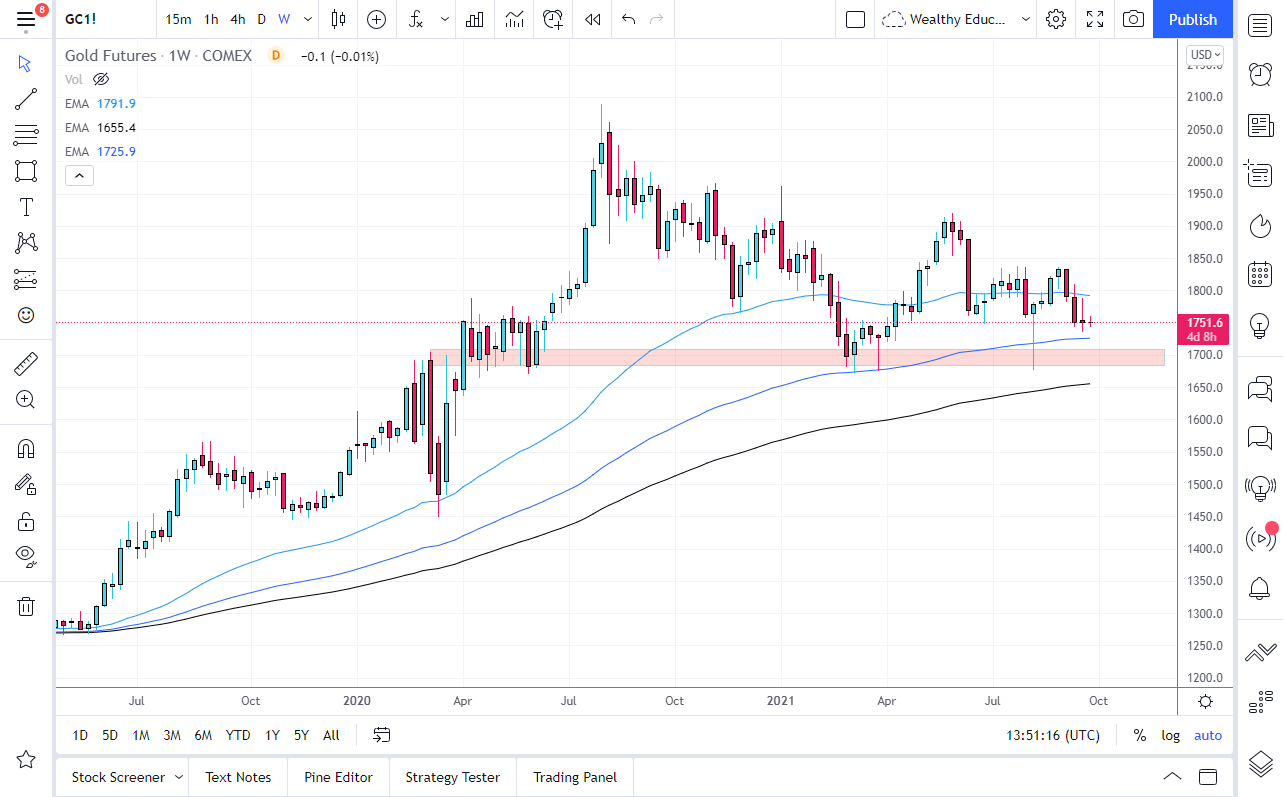
Gold markets have been slumping during most of the September month, reaching down towards the $1750 level multiple times. At the time of writing, the market certainly looks as if it is going to be pressing the downside, and it certainly does not look very healthy, at least at first glance.
What will be interesting and pressing for gold traders is going to be the 10 year yield. If the 10 year yield in the United States continues to rally the way it has, it makes holding paper much more profitable than paying for storage fees to own massive amounts of gold. In that scenario, gold loses, and starts to fall rapidly. This is part of what has been going on, as rates in the United States continue to rise. It comes down to a “real rate of return”, meaning whether or not the interest rates in the bond market are stronger than inflation.
From a technical analysis standpoint, you can see that the $1700 level has been important more than once. I also have the one, two, and three year moving averages plotted on the chart, and we are currently trading between the one and the two year levels. The area between $1750 and $1700 level has been rather supportive, extending down to the $1680 level. It is at the $1680 level that I believe the market falls apart, and gold crashes towards the $1500 level. As things stand right now, it certainly looks as if we are going to at least try to get down there and test the region.
However, if we were to turn around a break above the $1800 level, we will test the $1835 level, and then possibly even as high as the $1900 level. Remember, most retail traders simply look at this as a way to get away from inflation, but they forget the fact that bonds can be as well. In other words, if you are going to be trading this market you have to keep one eye on the 10 year yield, and whether it is rising or falling. There is a huge negative correlation between these two markets when momentum enters one of them, and that is exactly where you need to be focusing your efforts this next month. Furthermore, keep an eye on those 10 year yields can give you an idea as to whether or not the US dollar strengthens, which has a bit of a “knock on effect” over here as well.

