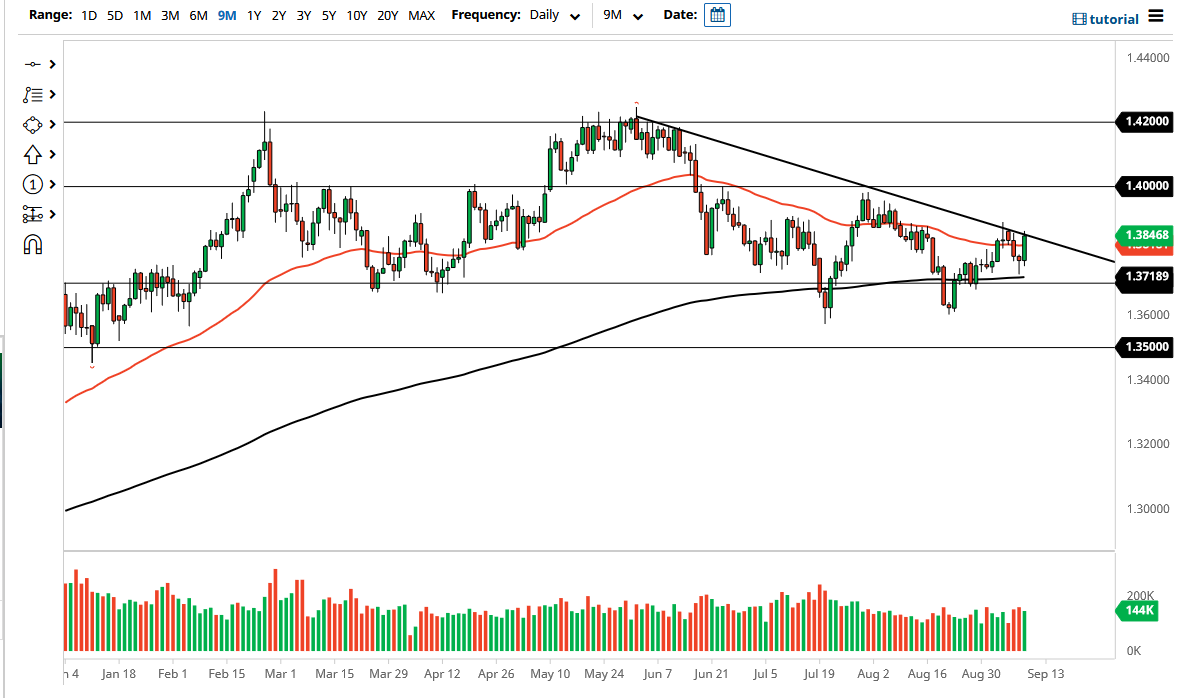
The British pound rallied significantly during the trading session on Thursday to slam into a major downtrend line that I have been tracking for a while. The market broke above the 50 day EMA, and that of course is something worth paying attention to as well. However, the 1.39 level has offered resistance yet again, and therefore I think that it is worth paying close attention to. All things been equal, this is a market that I think we pull back from these highs, but if we were to break above the 1.39 level, that would obviously kick off a whole new phase.
The size of the candlestick is rather impressive, as the British pound has been one of the better performers. However, this is not to say that we cannot turn around and break down below to reach into this candlestick again. You should also keep in mind that we have not broken to the upside, but we are trying to grind out of what is a tightening situation. If we do turn around a pullback from here, then the market goes looking towards the 200 day EMA which is sitting just above the 1.37 handle. The 1.37 level has been important more than once, and I think it is essentially a “zone of support” that extends down to the 1.36 handle.
The 1.36 level is a major support level that we have paid close attention to as of late, forming a “double bottom.” That double bottom being broken to the downside would send this market much lower, perhaps kicking off a major selling signal. However, if we were to turn around a break above that 1.39 level, that is likely we go looking towards 1.40 handle above. The 1.40 and of course is a large, round, psychologically significant figure, which has caused quite a bit of noise as of late. Breaking above that then opens up this market to a much bigger move. One thing you can probably count on in the short term is going to be a lot of choppy volatility, as nobody really seems to have a grasp on where inflation is going, or economic growth. This has been a bit of a headache for traders around the world, and I just do not see that changing anytime soon.