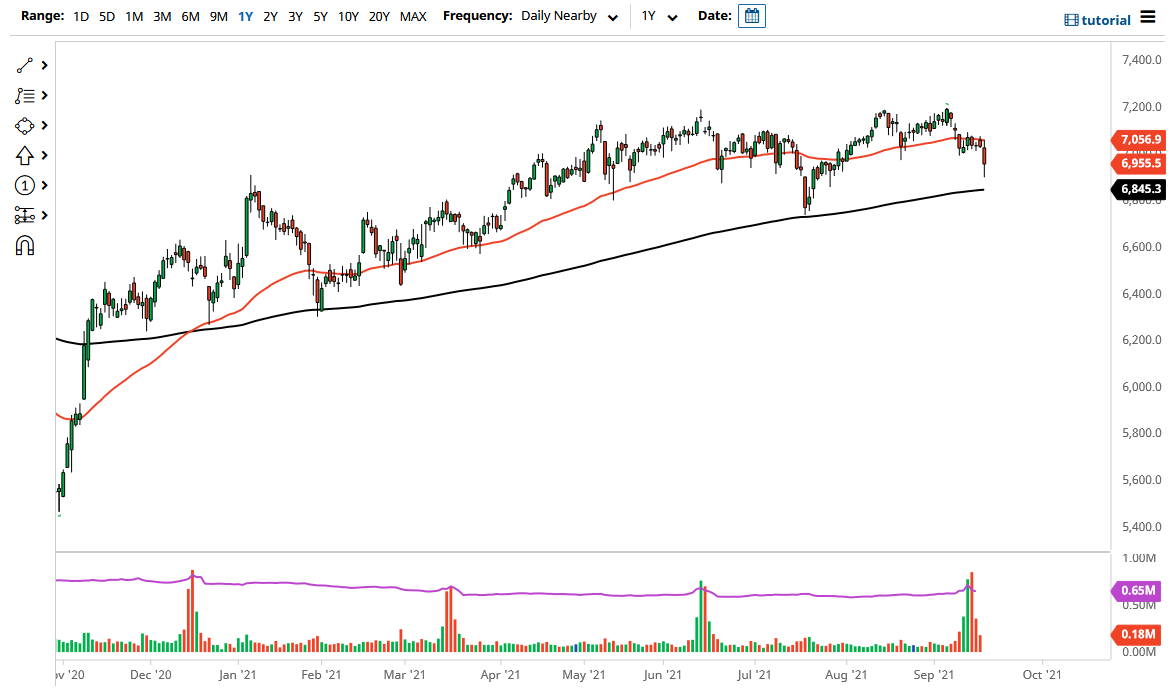
The FTSE 100 gapped slightly lower on Friday only to turn around and reach towards the 50-day EMA. The market then broke down rather significantly to reach towards the 6900 level. That being said, the market did bounce just a bit on Friday, so at least there is the possibility of it showing some signs of life. Nonetheless, what I am paying close attention to is the 200-day EMA.
As long as we can stay above the 200-day EMA, in theory this is an uptrend that should continue. Ultimately, this is a market that is very sensitive to the overall risk appetite of the world, just like other indices. That being the case, the market is likely to see a certain amount of value hunting in this general vicinity, because we are still in an uptrend. Beyond that, it is difficult to short indices in an environment in which central banks are willing to do anything they can to pick up markets. That being said, the 200-day EMA is an indicator that we need to pay close attention to.
If we do break down below the 200-day EMA, the market is likely to continue going much lower, perhaps reaching towards the 6500 level. That would be a very negative turn of events, but this is a market that is paying close attention to the United Kingdom and whether or not it is going to come out of the pandemic stronger or weaker than it once was. One thing I would say is that you have to look at the technical analysis more than anything else in this type of environment.
The 50-day EMA sits just above and causes resistance, so we need to pay close attention to it. It is sitting at the 7050 region, so I think that is the short-term ceiling for the market. As long as we stay below there, it is going to be difficult to continue being bullish, but I am not quite ready to start selling yet. If we were to break down below the 200-day EMA, I think at that point in time you would be able to start shorting again.