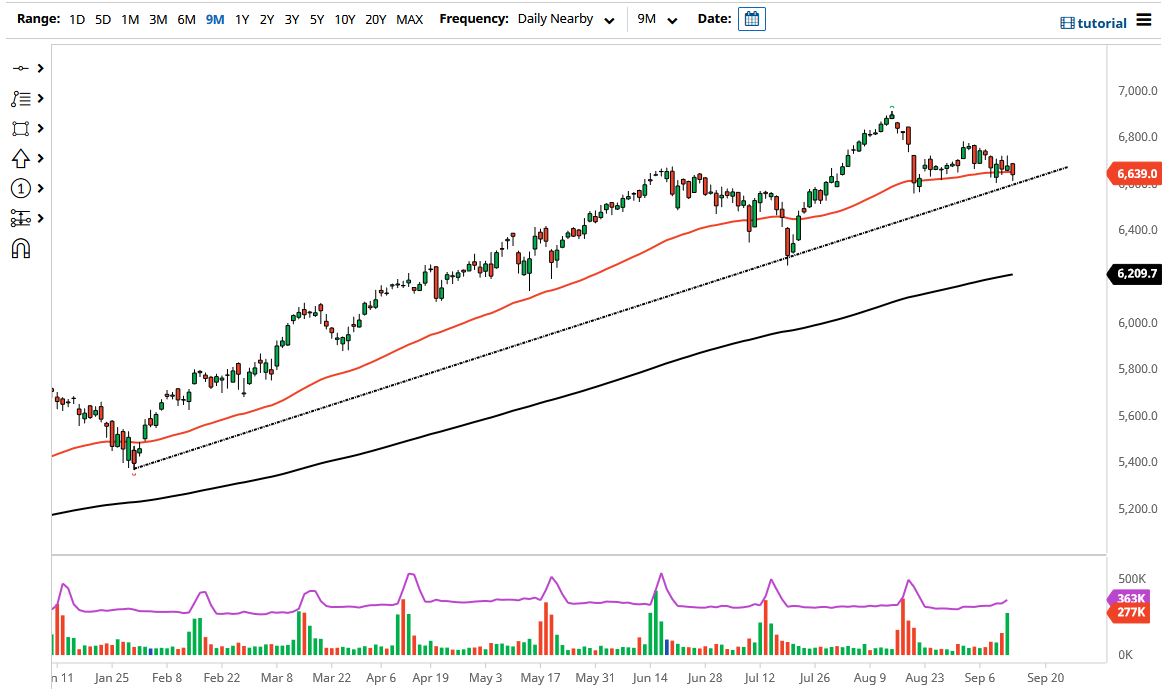
The CAC Index fell on Tuesday to slice through the 50-day EMA and go looking towards the uptrend line. The uptrend line has been very reliable over the last several months, so it will be interesting to see whether it holds going forward or not. The market is likely to continue seeing interest in this general vicinity, so if we can continue to hold not only that uptrend line but also the 6600 level where it slices through, then it is very likely that we will continue to see buyers.
However, if we do break down below the 6600 level, then it is likely that we go looking towards the 6500 level next, and then eventually the 6400 level. The 6400 level is an area that I think a lot of people pay close attention to base upon the fact that it was the general vicinity of the most recent pullback and bounce, so let us see whether or not the support comes back into the picture. After that, then the 200-day EMA would more than likely be the next technical indicator that people are paying the most attention to.
Looking at this chart, it is obvious that we are in an uptrend, but lately we have been consolidating sideways in order to figure out where we are going longer term. Quite often, you will see the market consolidate in order to digest the gains of the last several months, and with all of the questions right now about the global economy, it does make that there is no real confidence going forward. The Parisian index tends to move mainly on luxury goods, so it needs to see a lot of spending out there by high-end consumers in order to push higher over the longer term based upon profits. That being said, if we are starting to shut down again, then it is likely that we will see negativity in this market. In fact, Airbus is about the only company that comes to mind that could push this higher without luxury spending. Looking at this chart, we are still very much in an uptrend, but you need to be aware the fact that there is a certain amount of support underneath that could get violated.

