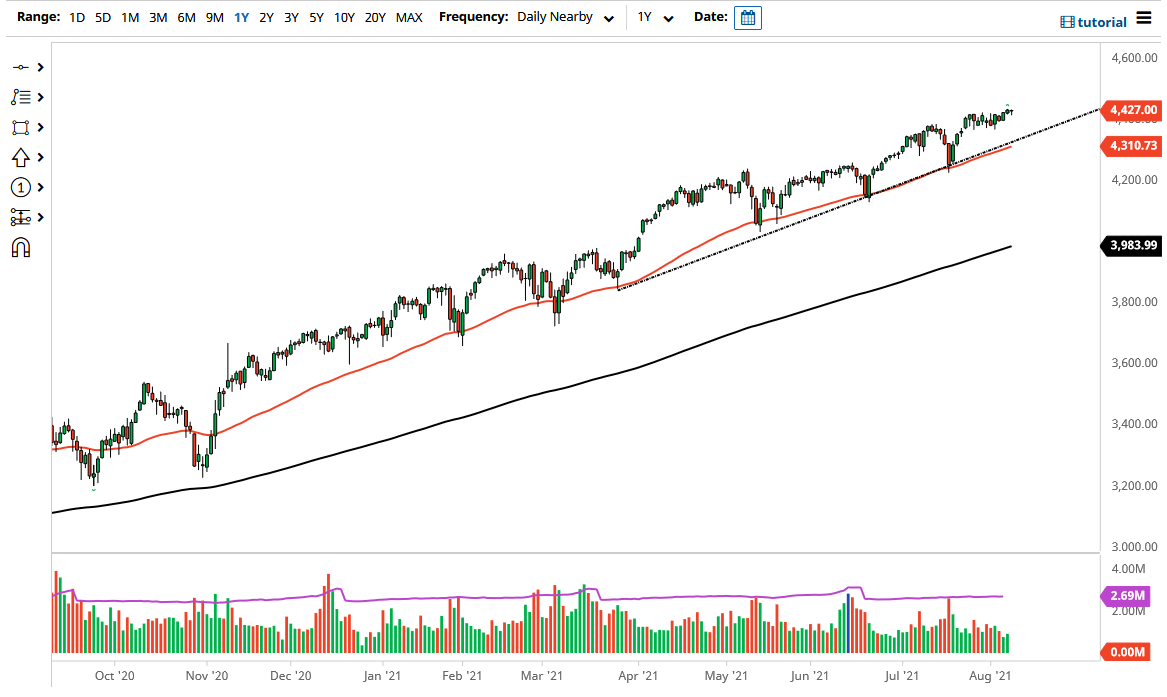
The S&P 500 drifted just a little bit to the downside to kick off the Monday session, but then turned around to show signs of strength again. Longer term, this is a market that continues to see a lot of upward momentum, perhaps as we go looking towards the 4500 level. We have the CPI numbers coming out later this week and that could come into the picture to give us an idea as to where inflation might be going. The market has slowly started to turn higher, and I think we will have a continuation move sooner rather than later.
Underneath, we have the 4400 level coming into the picture that could offer support as well. The 4400 level being a large, round, psychologically significant figure comes into the picture, but even if we break down below there, we have the uptrend line and the 50-day EMA coming into the picture after that, offering plenty of support that could lift this market even further. The market has been desperately looking for some type of pullback to offer value, and while I do not necessarily think that we will get some type of massive selloff, the risk of a pullback is most certainly real.
If we were to break above the 4500 level, then it is likely that we will go looking towards the 4600 level above as the S&P 500 likes to move in 200-point increments. On the other hand, if we were to break down below the 50-day EMA, then it is possible that we could go looking towards the 4200 level underneath, which is an area where we have seen support in the past. After that we have the 4000 level, where a lot of options barriers and big money will be sitting. The 200-day EMA sits just below there, and defining the trend will be paramount at that point. While it does seem like a big move, it is a typical 10% correction even if we get that kind of massive selloff. In other words, we will continue to buy dips going forward, as the Federal Reserve or Wall Street will come up with some type of narrative to make stocks go higher over the longer term.