The difference between success and failure in Forex trading is likely to depend mainly on which currency pairs you choose to trade each week and in which direction, and not on the exact trading methods you might use to determine trade entries and exits.
When starting the trading week, it's wise to look at the big picture, significant trends and critical levels in the market, and what fundamental drivers could affect them.
15th August 2021 Weekly Commentary:
In a relatively light week for U.S. economic data releases, all eyes were on the latest inflation numbers. The July Consumer Price Index (CPI) rose by 0.5%, in line with forecasts and nicely below the 0.9% registered in June. Core consumer price inflation, which excludes volatile food and energy costs, came in at 0.3%, slightly below the forecasted 0.4%, and well below the previous month’s core CPI number of 0.9%. This slowdown in inflation appears to align with the U.S. Federal Reserve’s narrative that recent spikes in inflation are transitory as the economy works through pandemic-related bottlenecks. However, the Producer Price Index (PPI) increased by 1.0%, well above the forecasted 0.6%. Upon the release of the PPI data on the morning of 12th August, the market sold-off for a couple of hours, before rebounding and finishing the day up from its opening price.
Key Highlights
The S&P 500 notched up another positive week, continuing the uptrend that began on 24th March 2020.
The EUR/USD bounced off a support level created on 29th March to end the week in positive territory, potentially setting us up for another positive week, although the long-term picture looks bearish.
The GBP/USD was almost unchanged by the end of the week; it has been in a sideways channel for about six months, and, similarly to EUR/USD, its bigger picture also looks bearish.
The USD/CAD trend that started at the beginning of June now looks weak, with ominous resistance areas formed over the last two weeks.
Bitcoin delivered a fourth positive week in a row after having bounced off a key support level.
US Dollar Index (DXY)
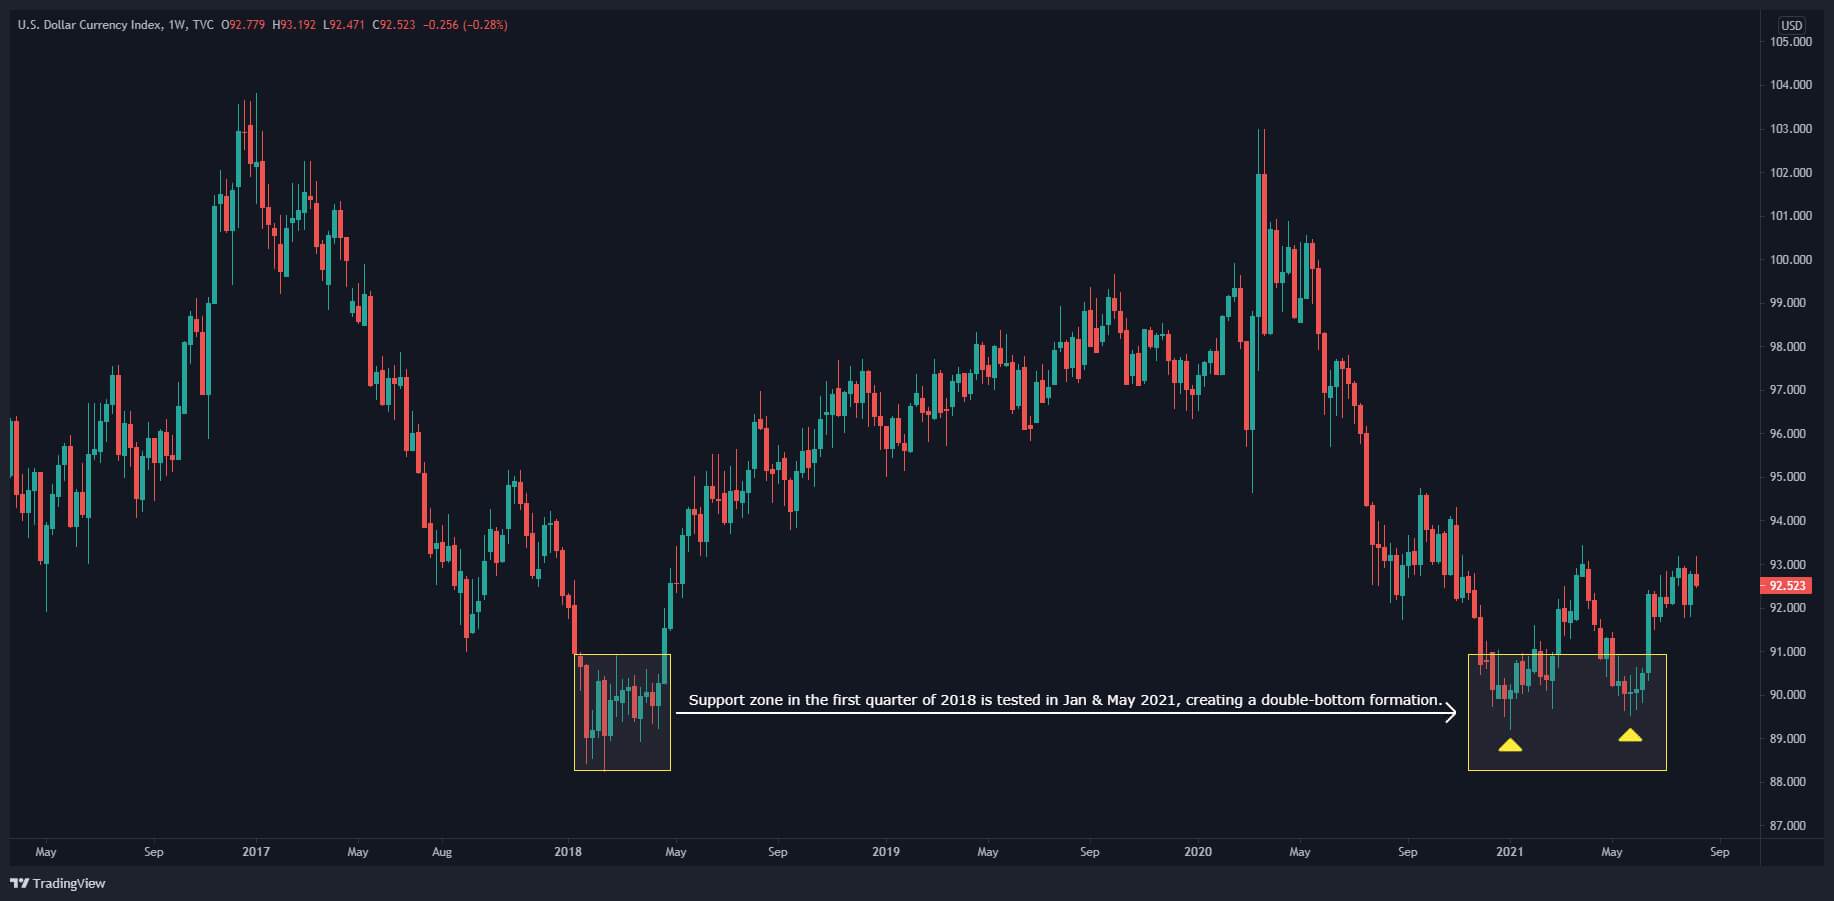
The US Dollar Index created a double-bottom formation on the chart in January and May 2021, which lined up with a support area made in early 2018, giving it a firm base to launch an uptrend.
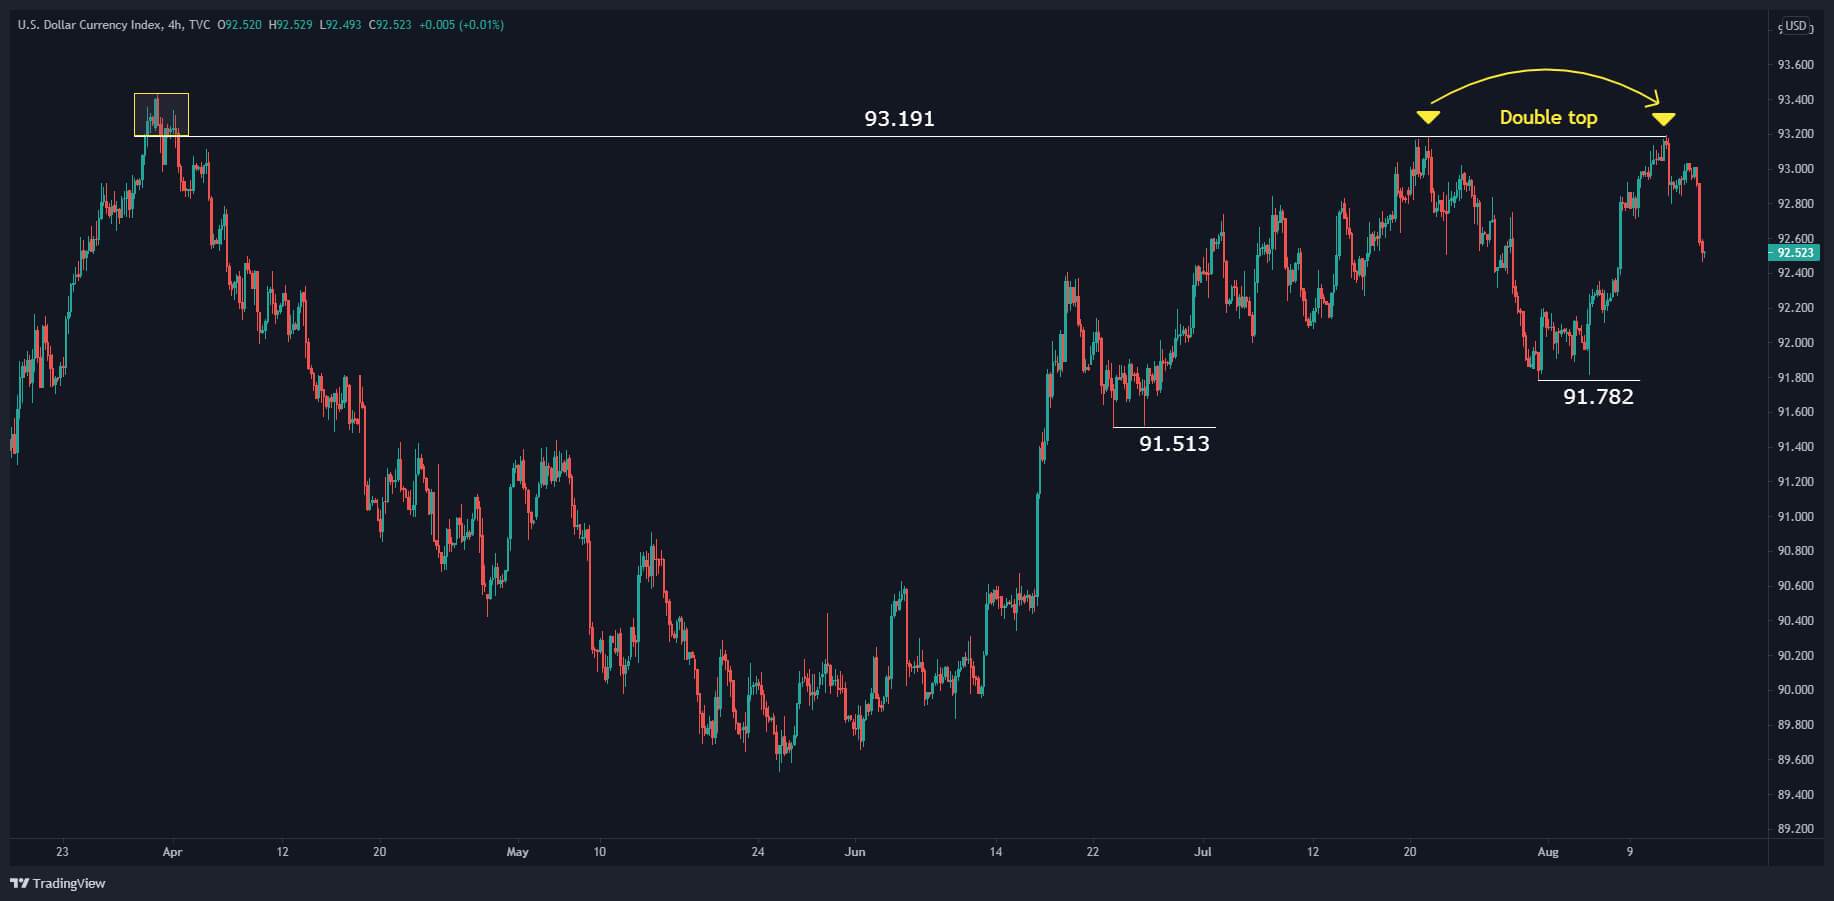
However, the DXY reacted bearishly against previous resistance at 93.191, with a large selloff on Friday, producing an almost perfect double-top spanning the last three weeks. That said, the index is still technically in an uptrend on the 4-hour chart until the previous support at 91.782 is broken. A break of 91.513 would be even more bearish.
S&P 500
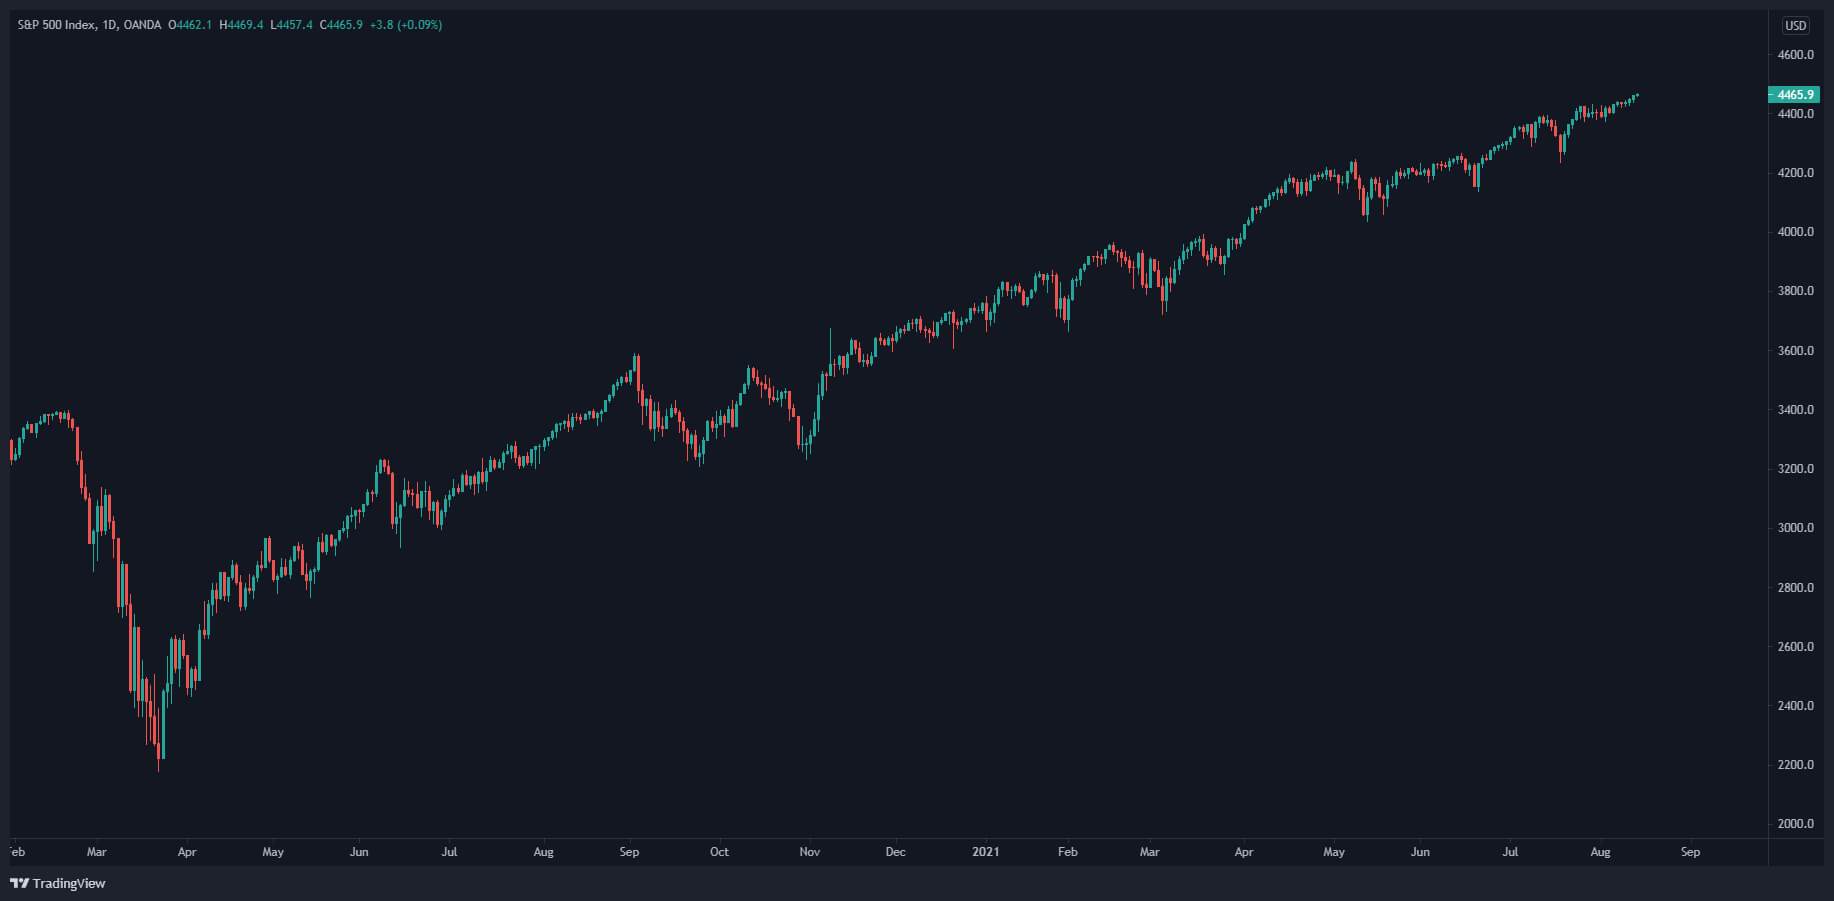
The S&P 500 notched up another positive week, continuing the uptrend that began on 24th March 2020. With the price in record-high territory, there are no previous resistance levels to slow down its long-term bull run (that doesn’t mean that the trend won’t pause or reverse at some point, but it will probably require an economic shock to make that happen). To repeat the words in my last market commentary, the first piece of investing advice I got was, “Buy the stock market, and just hold it.” The actions of the S&P 500 is proving this statement correct. After a precipitous sell-off in Feb/March 2020 when the global impact of COVID became apparent, it made back its losses and marched into new highs with the confidence of a star athlete. The index has shaken off, with remarkable speed, any concern you could throw at it, from peaking economic growth, historically high valuations, coronavirus variants, and extreme weather events, to name a few.
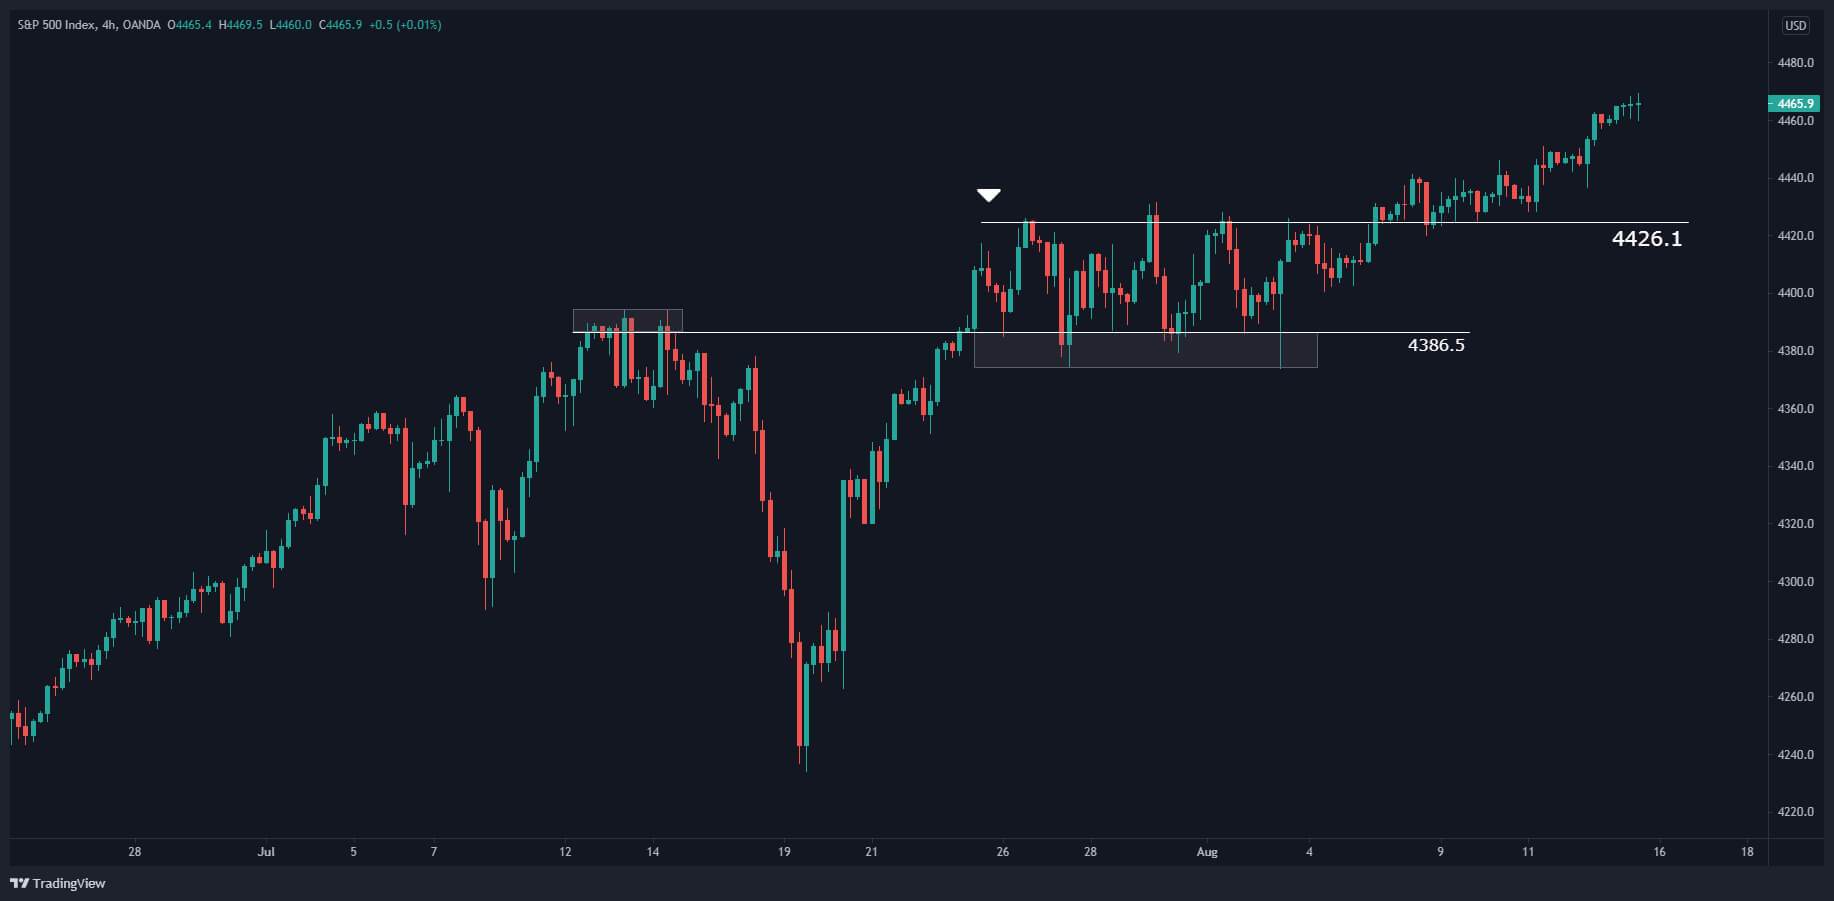
Our S&P 500 strategy is to buy on dips, preferably when it retests previously broken resistance levels, and we’ve identified levels in previous market commentaries. This has worked particularly well on the release of bearish economic data. For example, on Thursday, the U.S. Bureau of Labor Statistics released the monthly Producer Price Index (PPI) numbers, a key inflation indicator. It came in higher than expected (1.0% compared to the forecasted 0.6%). The market sold off for a couple of hours, only to turn around and close higher than its open that day and make a new closing high the next day.
The most recent previously broken resistance levels that could potentially act as supports on dips are 4426.1 and 4386.5
What would make me reconsider the uptrend and look for a potential market reversal or at least a pause in the trend? If the market broke the support levels at 4234 (made on 19th July), 4138 (made on 21st June), and 4035 (made on 13th May). The last significant support before that was made way back in September 2020 at 3210.
EUR/USD
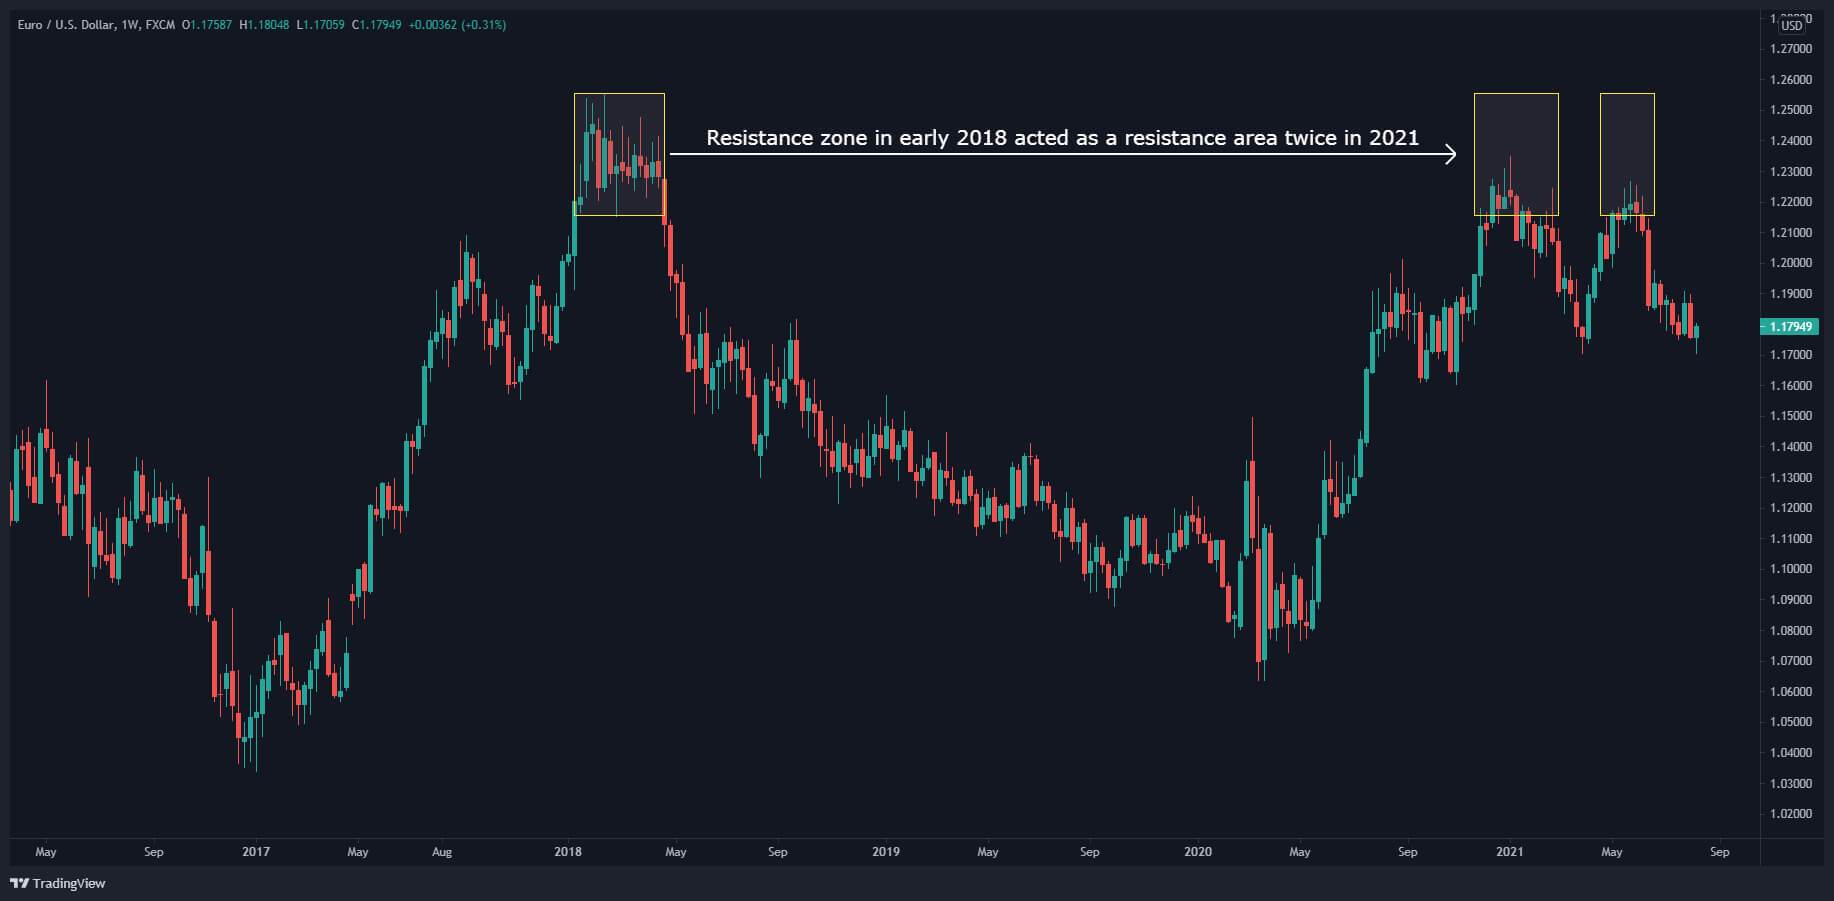
The EUR/USD is potentially starting a new downtrend. A reversal zone made in the first quarter of 2018 was tested in January 2021 and May 2021, creating a double-top formation on the chart.
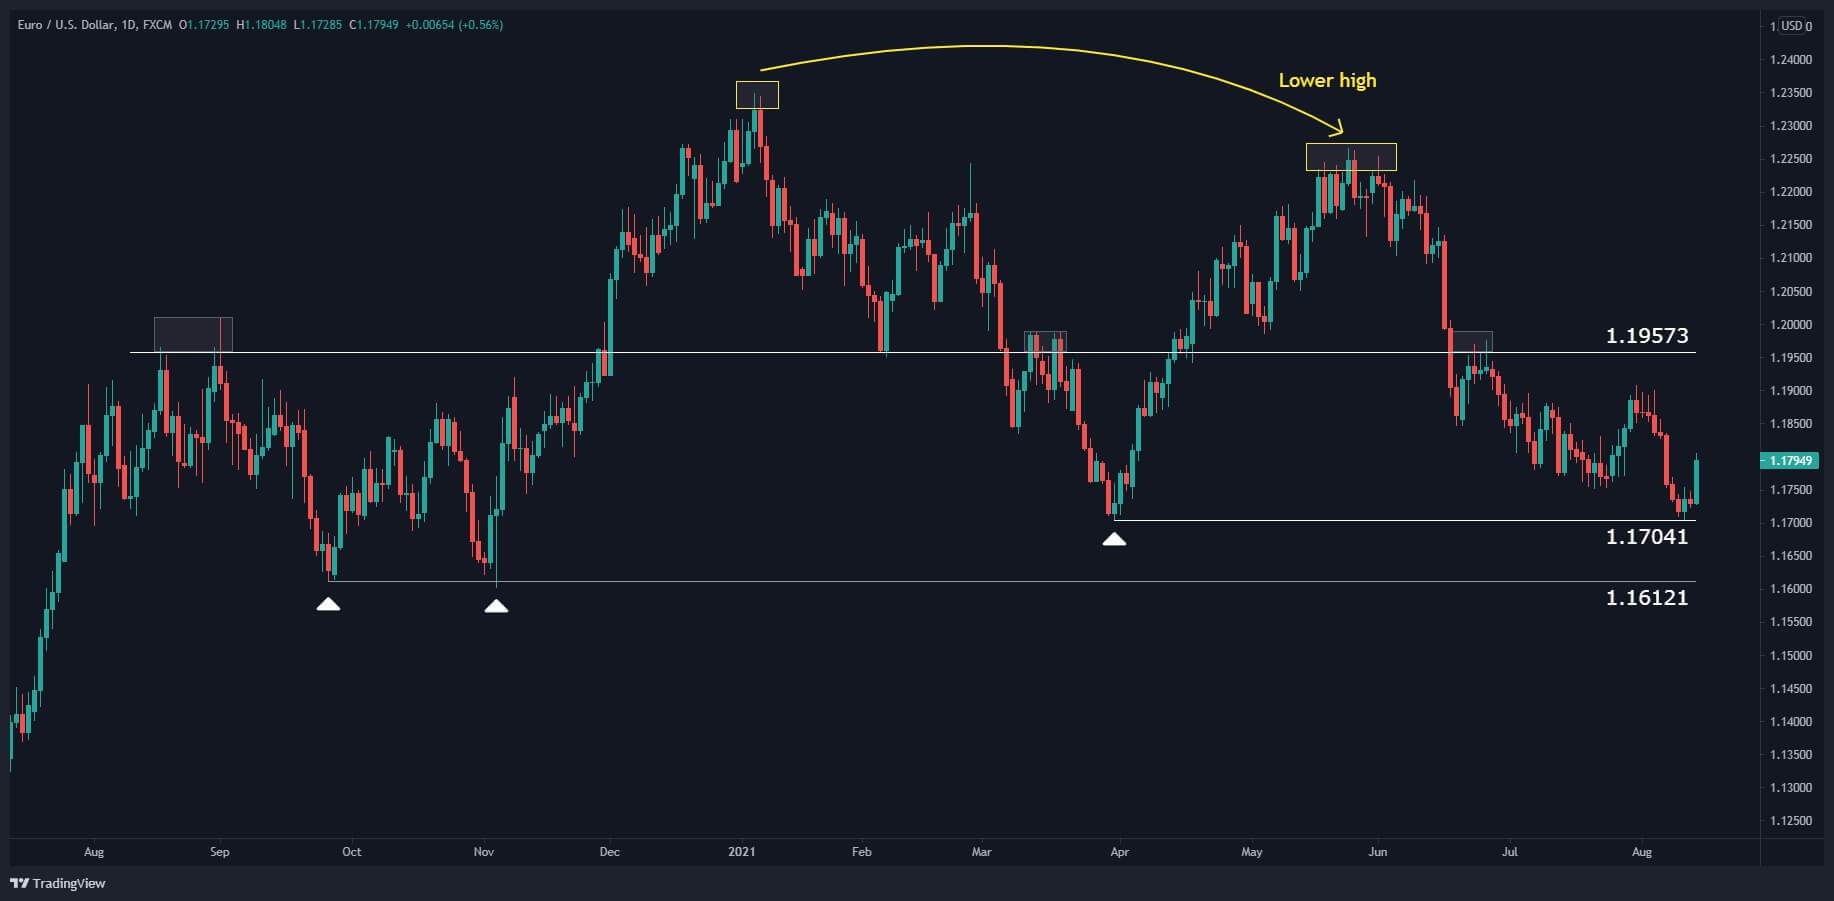
On the daily chart, the market is below 1.19573, a key interchangeable support/resistance level, again a bearish sign. However, the price bounced off a previous support level, 1.17041 last week, effectively producing a channel between 1.17041 and 1.19573. The bounce also potentially sets up another bullish week ahead. We want to see the price break at least 1.17041 and 1.16121 to be more confident of a bearish outlook. 1.17041 is more important because it is the support in between the high in January and the high in May.
GBP/USD
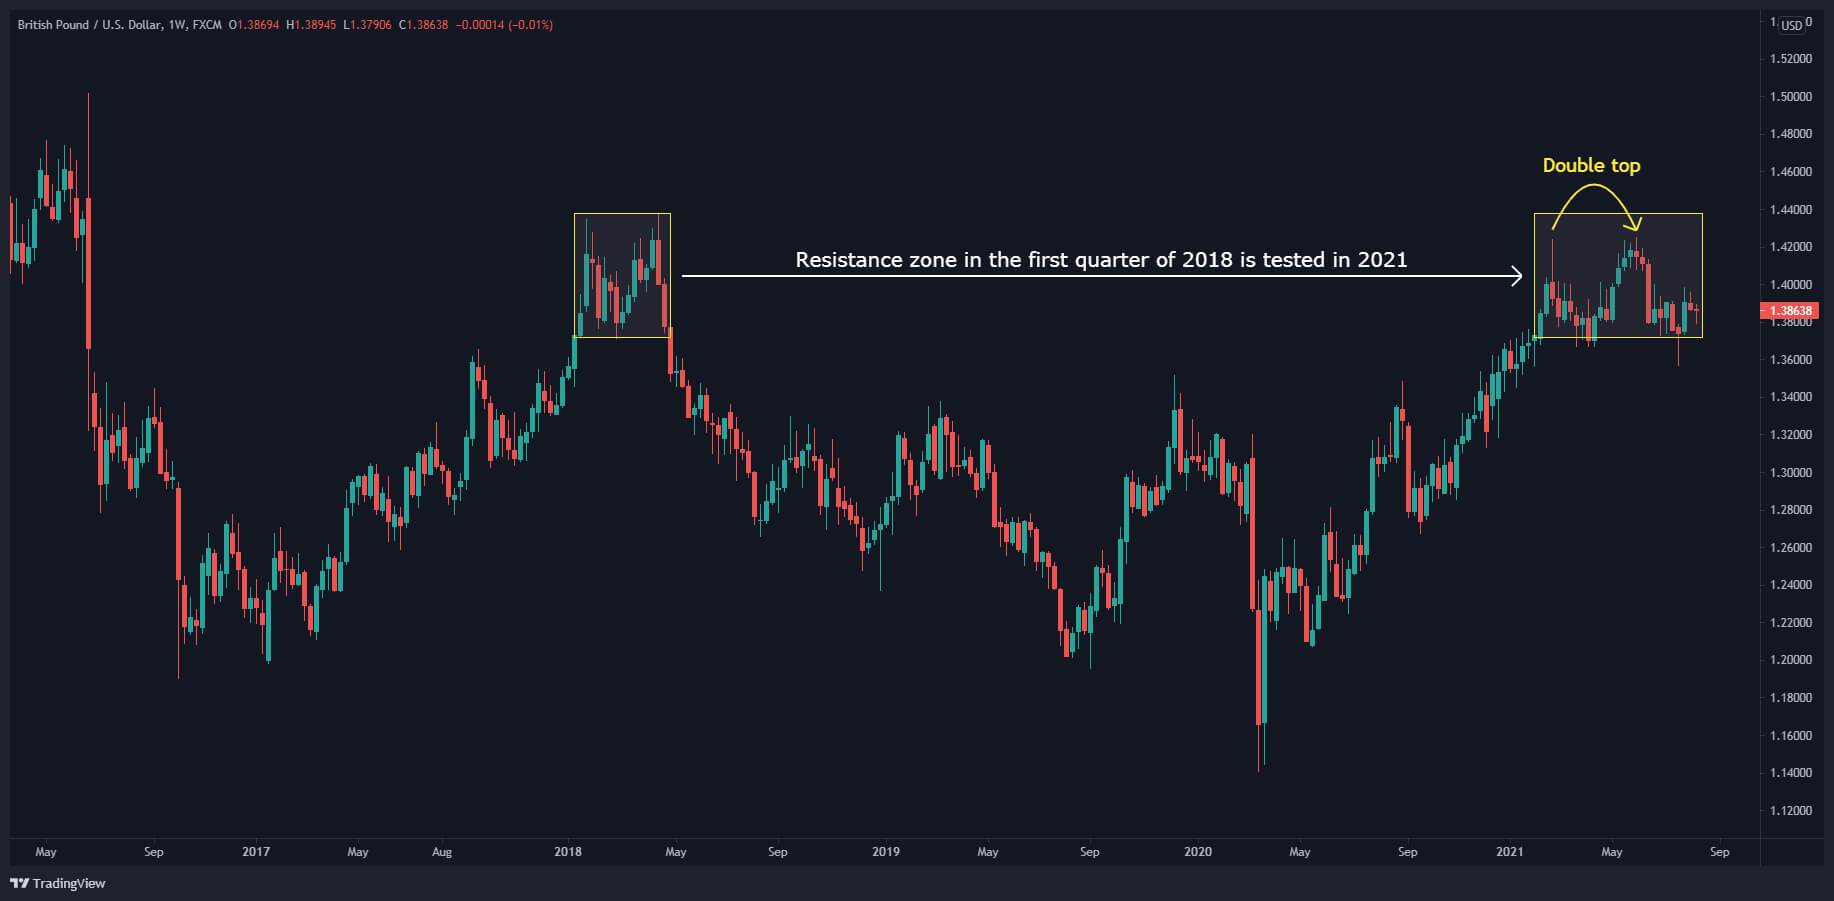
A reversal zone made in the first quarter of 2018 was tested in February 2021 and June 2021, creating a double-top formation on the chart. But the price is still firmly in the reversal area.
On the daily chart, it’s clear the price is stuck in a sideways pattern. That said, there are several clues to a potential bearish move. The price made a double-top, and the second peak was a “rounded top” formation that can act as a strong resistance.
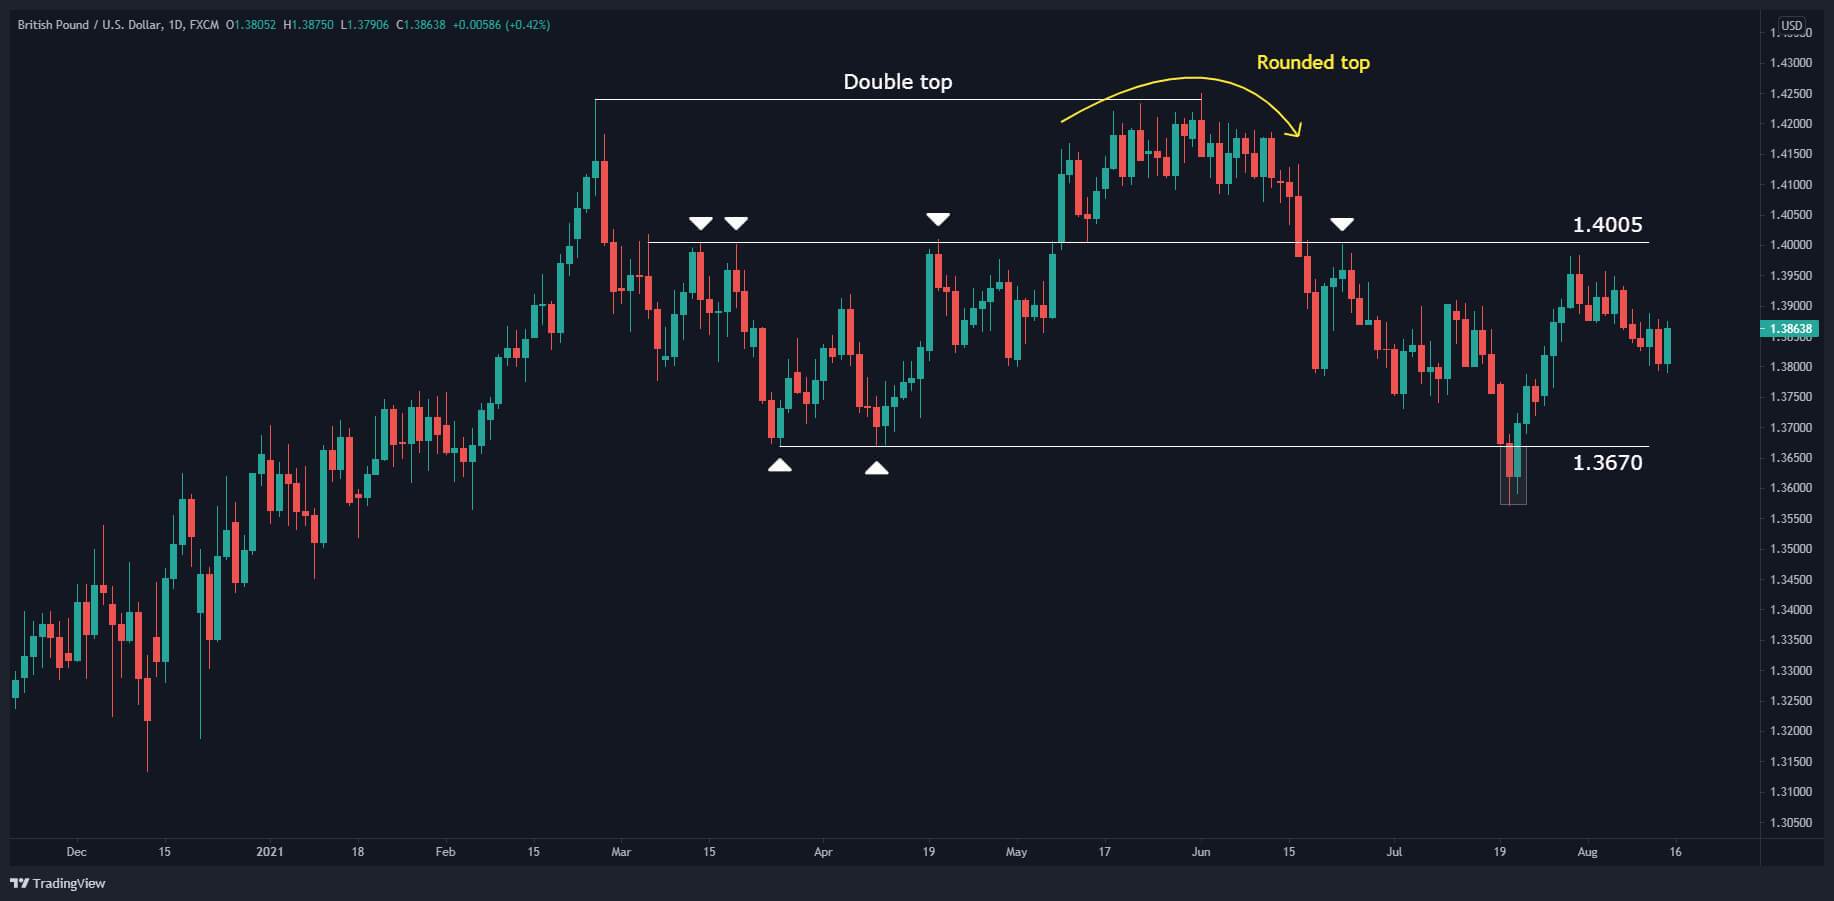
Looking at where the price is sitting right now, it is below 1.4005, a key interchangeable support/resistance level. Last week, the price trended down for most of the week before having a bullish Friday to leave it near where it opened for the week. In that sense, our commentary on this pair is almost identical to the previous week, but because it is sitting in a long-term resistance area with the potential to breakout, we want to highlight it again.
We want to see the price break the support at 1.3670 to be more confident of our bearish sentiment (and 1.3572 – the low made on 20th July – to be even safer).
USD/CAD
Over May & June 2021, USD/CAD bounced off a long-term support level made in September 2017 at 1.20613.
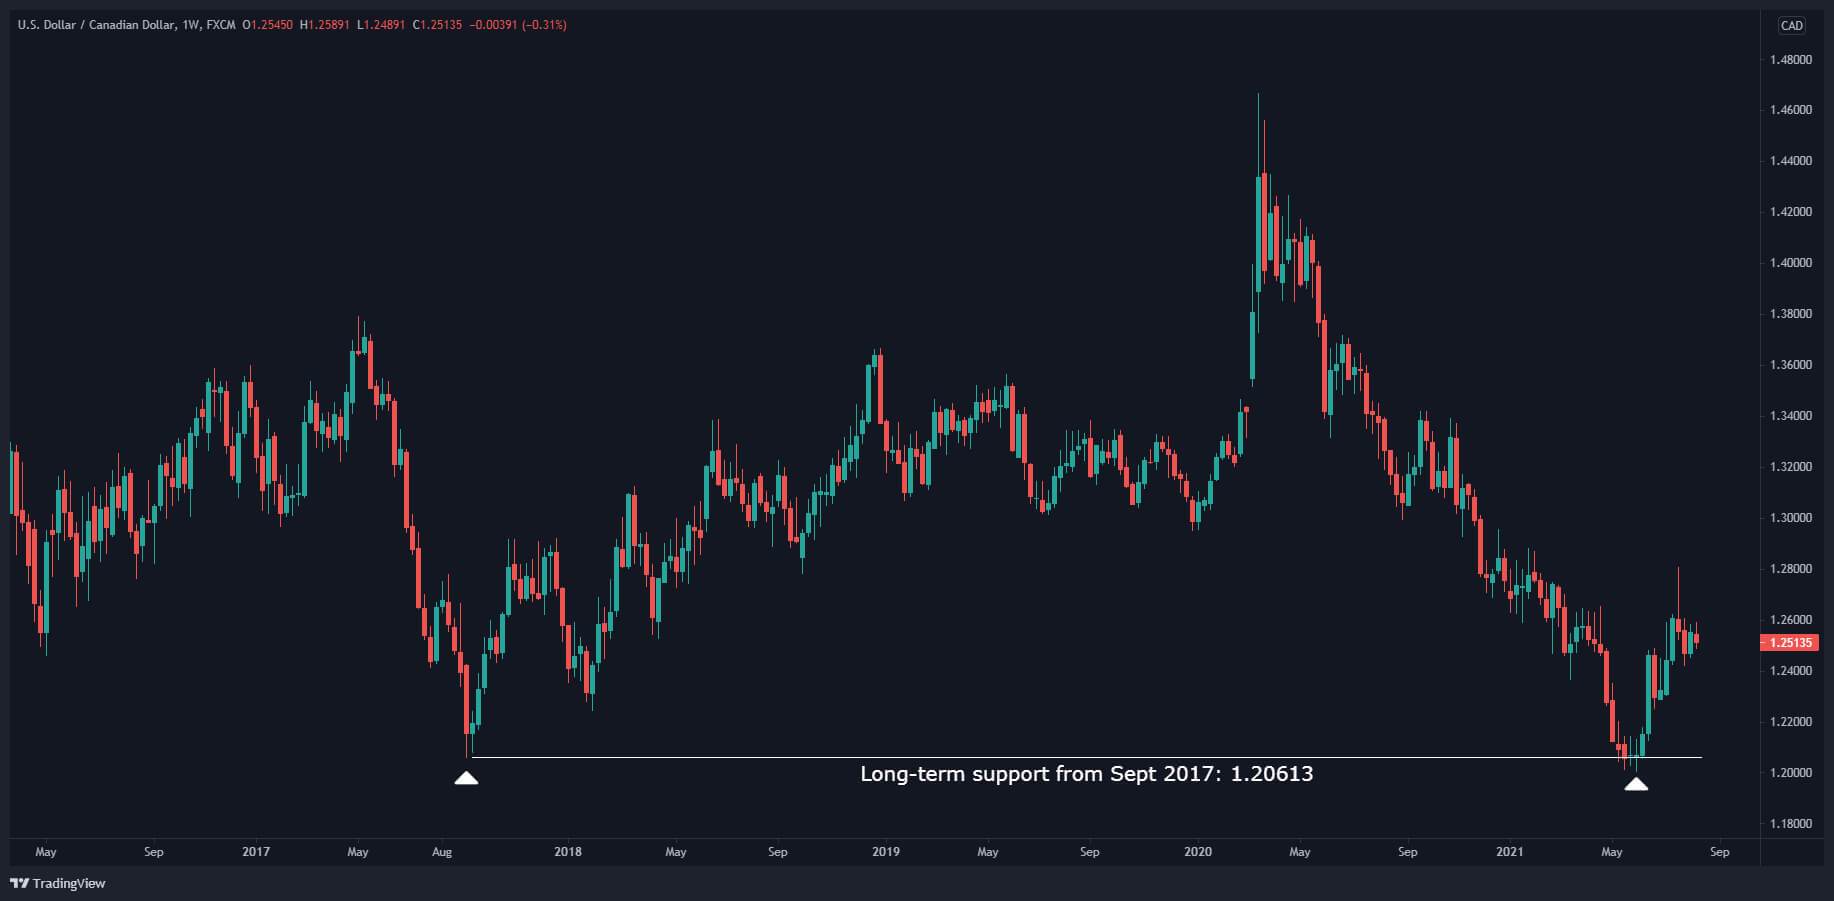
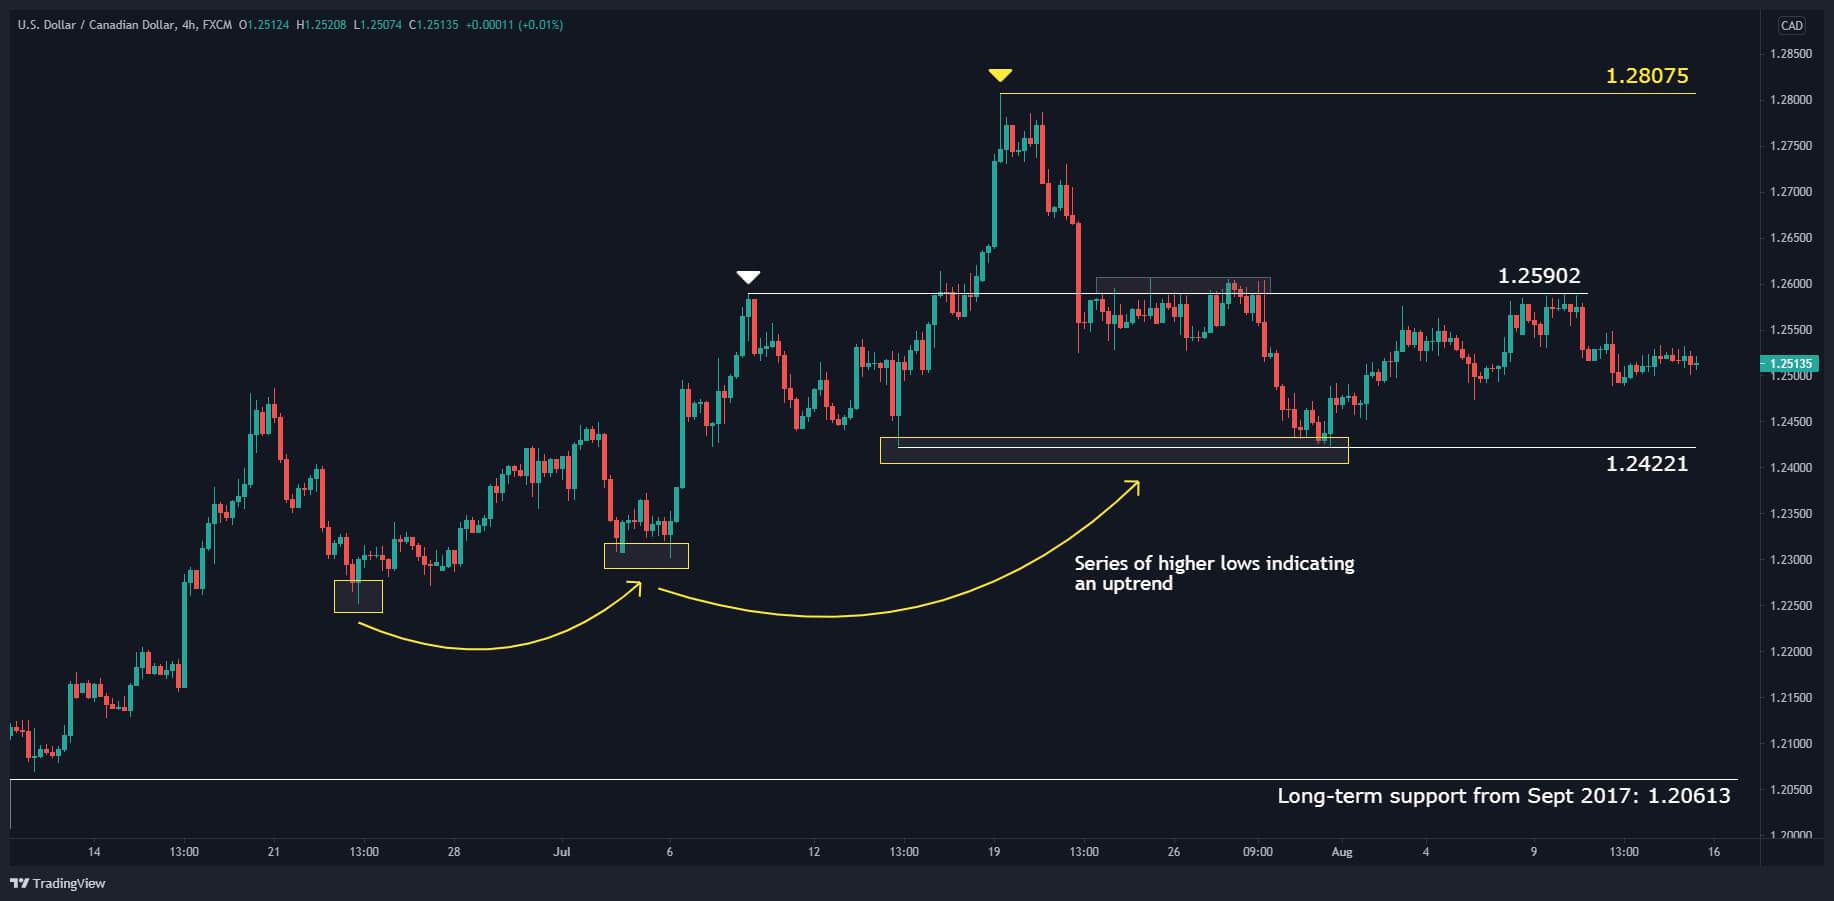
Visible on the daily and 4-hour charts, the price has made a series of higher lows since June 2021. However, recently, it has stalled and resistance at 1.25902 has appeared. The price must break the 1.25902 level for us to continue to feel bullish on the USD/CAD. The next resistance that could stall the price is 1.28075. If the price breaks the support at 1.24221, we would be neutral to bearish on the pair.
BTC/USD – Bitcoin
Although Bitcoin is relatively new compared to other asset classes, it can produce clean technical levels because it is massively liquid. That means we can analyze it like many other instruments.
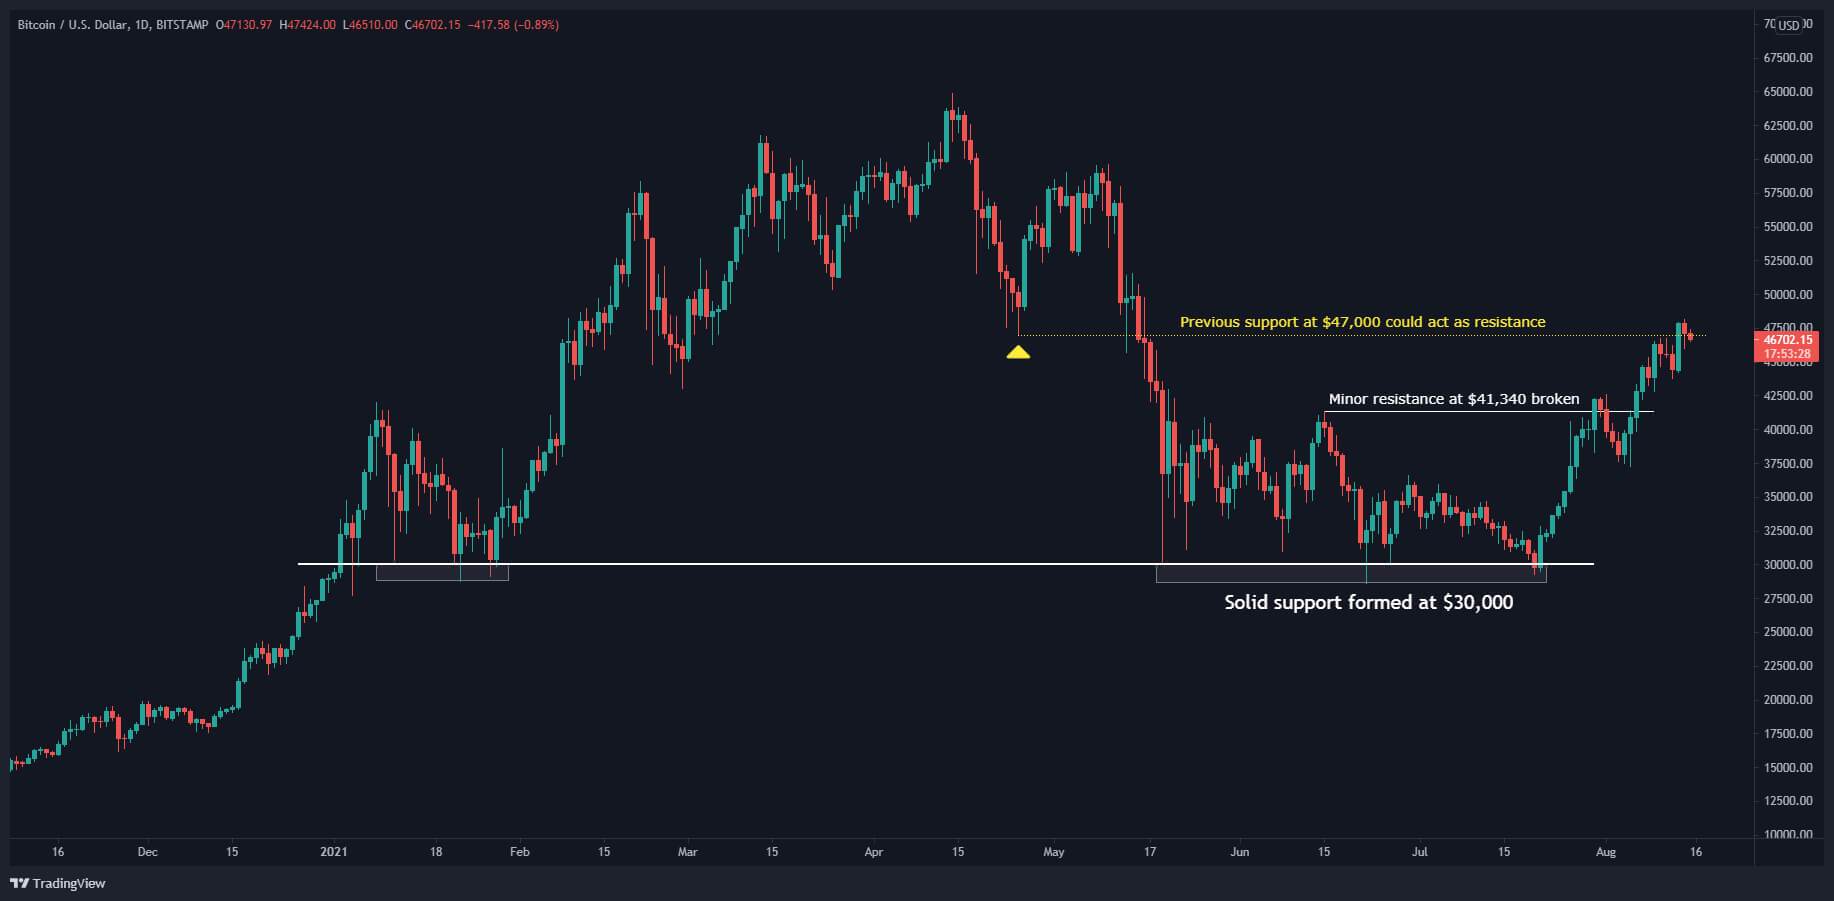
After losing more than half its value since its peak in April 2021 at nearly $65,000, it found support at $30,000 in May 2021. That support level held until late July when it began an uptrend and broke the last minor resistance at $41,340. Last week, it notched up another impressive weekly gain. The only note of caution is that the previous support level, $47,000, could act as a resistance.
Summary
The best opportunity I see in the markets is to go long S&P 500 – I would look at the 4-hour chart to buy off support levels. Next, the best opportunity is the bullishness in Bitcoin, if you have the stomach for its volatility!
I am monitoring the levels outlined above for the EUR/USD and GBP/USD. Both have bearish pictures on the larger timeframes, but EUR/USD has bounced off a confirmed support level visible on the daily timeframe, and GBP/USD is in the middle of a channel.
USD/CAD will break out from the tight price range visible on the 4-hour chart and provide trading opportunities.
