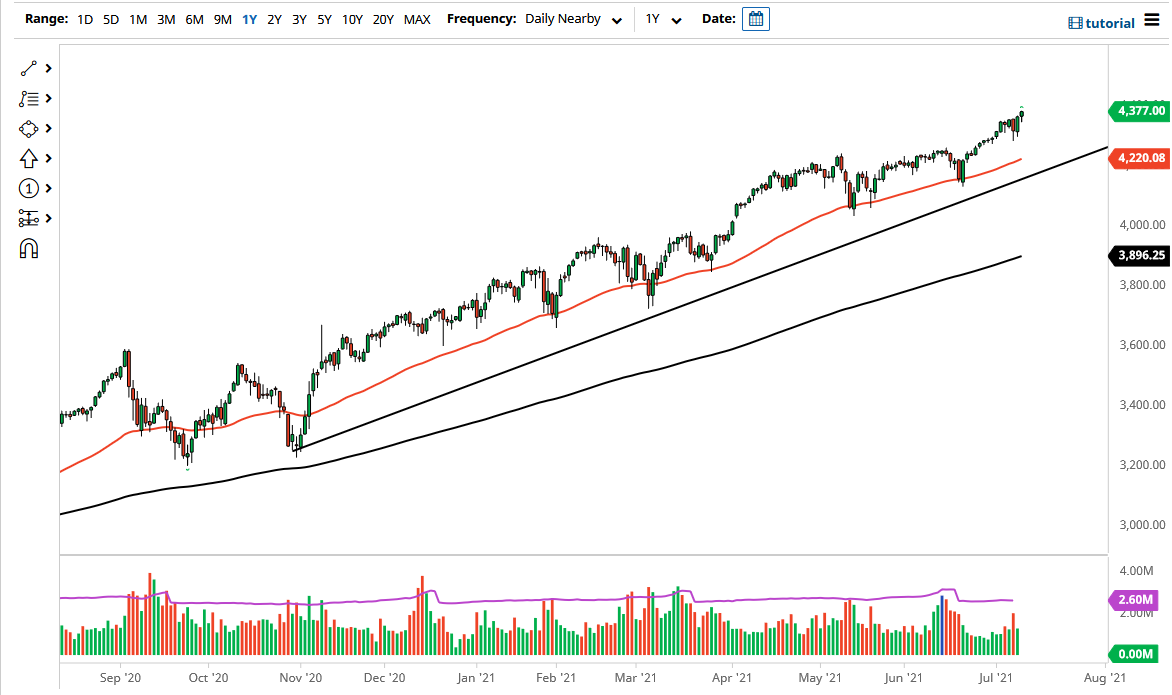
The S&P 500 initially pulled back during the trading session on Monday, but then turned around to show signs of strength. Because of this, it looks like we are ready to continue the overall uptrend that we see in this market, which should not be a huge surprise considering we have almost gone straight up in the air of the last 13 years. Granted, there has been the occasional sharp pullback, but the index is designed to go higher over the longer term, so the fact that we rally over time should not be a huge surprise. That being said, it is also interesting to note that every time the market has sold off sharply, the Federal Reserve says or does something to assuage nerves.
This market does tend to move in 200-point increments, and that suggests that we could be going to the 4400 level, which is not that far away. It is not a real stretch of the imagination to think that we could get there, and I think it is all but a foregone conclusion. To the downside, that also means that we could be looking at the 4200 level for support. We also have the 50-day EMA sitting in that area, so it all ties together quite nicely. Underneath there, we have a longer-term trend line that also comes into play, and then obviously the 4000 level which is a large, round, psychologically significant figure that will attract a lot of headline attention. There is also a small gap there, so I think all that ties together for a “buy on the dips” type of scenario, just as a break above the 4400 level probably opens up the possibility of the market going to the 4500 level. That does not mean that I will give up on the 4600 level, just that the 4500 level is a “midcentury mark” that will attract a certain amount of attention.
If we were to break down below the 4000 level, I might be a buyer of puts, but that is about as bearish as I get on US indices, because the Federal Reserve is notorious for getting involved in the markets and supporting them. Beyond that, the index is not equally weighted, meaning that just a handful of the popular stocks will continue to have the most influence.

