Bearish View
Sell the BTC/USD and add a take-profit at 28,000.
Add a stop-loss at 31,000.
Timeline: 1-2 days.
Bullish View
Set a buy-stop at 30,500 and a take-profit at 32,000.
Add a stop-loss at 28,000.
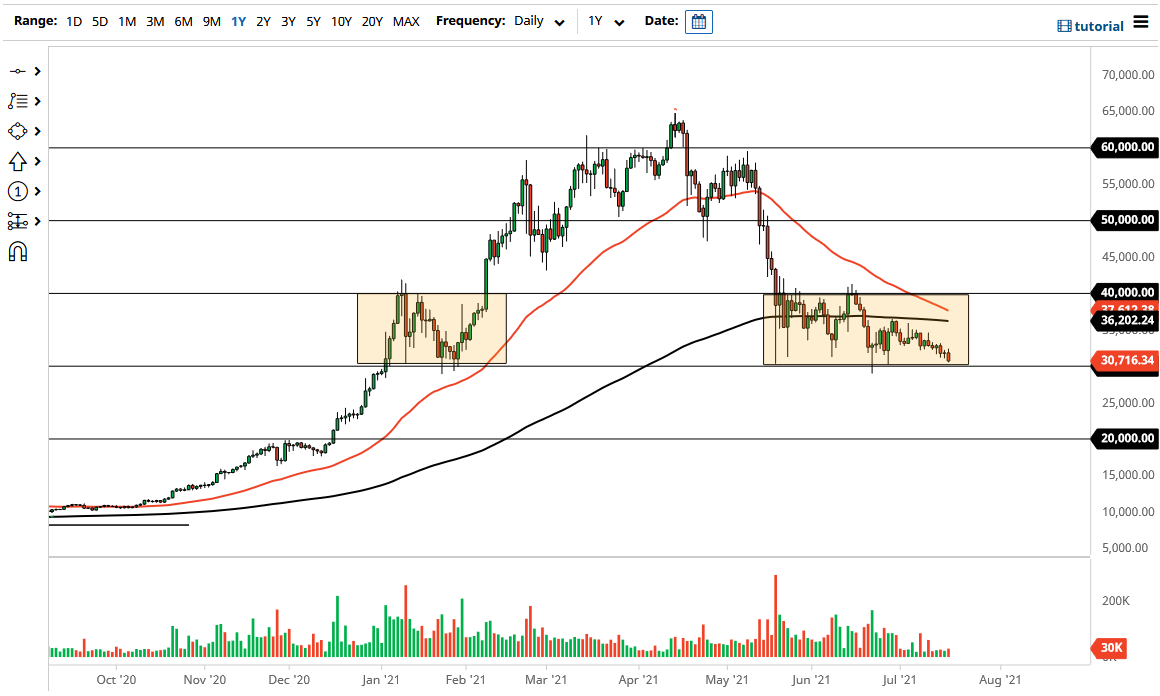
The BTC/USD pair crashed below the 30,000 support level on Monday as global markets crashed. The Bitcoin price declined to $29,692, which was the lowest it has been since June 22. This drop brought the coin’s total market capitalization to more than $556 billion. All cryptocurrencies tracked by CoinMarketCap have seen their market value fall to more than $1.19 trillion.
Bitcoin Price Breaks Key Support
The BTC/USD struggled on Monday and Tuesday evening as investors rushed to the safety of the US dollar as the number of COVID cases rose globally. In the US, the number of cases have risen in all states. Similarly, in the UK, the number of daily cases has risen to more than 68,000. In Australia, states like Victoria and New South Wales have even reinstated their restrictions.
Therefore, the weakness of Bitcoin prices was correlated to that of other financial assets. For example, the US dollar lost more than 800 points while the NASDAQ 100 and S&P 500 indices declined by more than 1%. In Europe, indices like the DAX and CAC 40 also declined by more than 1%. Still, there is hope, since most index futures have bounced back, with the Dow adding more than 200 points.
Bitcoin price has also struggled because of the relatively low volume as most investors remain cautious about buying a coin that has lost more than 50% of its value in the past two months. Many people have struggled placing bids above the $34,000 resistance level.
Subsequently, many companies that deal with the coins have seen falling volumes. For example, companies like Coinbase and Binance have seen their volume fall by more than 50% from May. This is also because of the rising fears of high-interest rates and tighter regulations.
BTC/USD Technical Analysis
The four-hour chart shows that the BTC/USD was in a tight range in the past few days. As a result, it formed a descending channel that is shown in black. The pair made a bearish breakout below this support as the sell-off in global stocks continued. It has also moved below the 25-day and 50-day moving averages (MA) while the Relative Strength Index (RSI) have also declined. Therefore, the next key level to watch will be the support at $28,666, which was the lowest level in June. A drop below this level will bring the next reference level to $25,000.

