Bearish View
Set a sell-stop at 31,000 and a take-profit at 30,000.
Add a stop-loss at 32,500.
Timeline: 1-3 days.
Bullish View
Set a buy-stop at 32,000 and a take-profit at 33,000.
Add a stop-loss at 31,000.
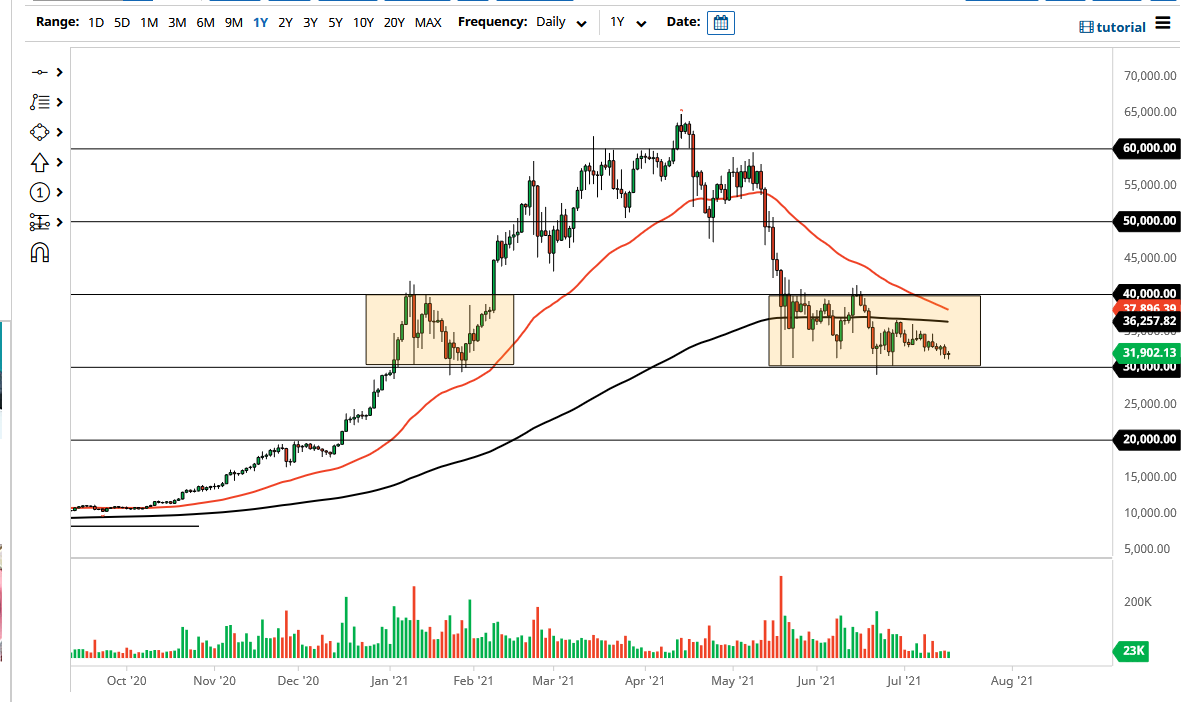
The BTC/USD price is still in a tight range as investors wait for the next catalyst. Bitcoin is trading at $31,563, where it has been in the past few weeks. That has brought its total market capitalization to more than $592 billion, which is substantially lower than where it was in the previous week.
Bitcoin Consolidation Continues
The BTC/USD pair surged from March 2020 to May this year as demand for the coin rose. This happened after the Federal Reserve implemented the most expansionary policy ever. In it, the bank decided to cut interest rates to zero and then launch an aggressive $120 billion per month quantitative easing policy.
These policies helped push more traders into cryptocurrencies and other risky assets. As the prices rose, more investors kept buying hoping to generate substantial returns. At their peak, cryptocurrencies had a market capitalization of more than $2 trillion.
Recently, however, the BTC/USD pair has been under pressure. It has dropped by 50% and its demand has almost evaporated. This price action has coincided with a period in which the overall inflation has been rising. Last week, data from the US showed that the headline Consumer Price Index (CPI) rose to 5.4% in June while core CPI rose to 4.2%. This was the highest growth rate since 2008 and 1991, respectively.
Therefore, many investors are bracing for a new wave of tightening by the Federal Reserve. In his testimony last week, Jerome Powell said that the bank will do more to prevent higher inflation. He also insisted that the bank expects consumer prices will cool down later this year. As such, the BTC/USD price is consolidating as investors wait for a definitive guide from the Fed.
BTC/USD Forecast
The four-hour chart shows that the Bitcoin price has been in a downward trend in the past few weeks. Along the way, the coin has formed a descending channel that is shown in black. It has also moved below the 25-day and 50-day moving average while the width of the Bollinger Bands has narrowed, which is a sign of low volatility. The pair is between the black descending channel. Therefore, the pair will likely remain in this range in the next few days. The key support and resistance levels to watch will be 30,000 and 34,000.

