Bearish View
- Sell the AUD/USD and add a take-profit at 0.7460.
- Add a stop-loss at 0.7580.
- Timeline: 1-2 days.
Bullish View
- Set a buy-stop at 0.7530 and a take-profit at 0.7600.
- Add a stop-loss at 0.7480.
The AUD/USD was little changed in early trading as investors reflected on the latest US non-farm payrolls (NFP) and the upcoming Reserve Bank of Australia (RBA) interest rate decision. The pair is trading at 0.7520, which is about 1% above the lowest level last week.
RBA Decision Ahead
The top catalyst for the AUD/USD will be the latest RBA interest rate decision scheduled for Tuesday morning. Analysts expect that the bank will hold its interest rates intact at 0.10%. They also expect the bank to sound a bit dovish because of the ongoing threat of the Delta variant of coronavirus. As such, the bank will likely maintain its asset purchases program as it tries to boost the economic recovery.
The decision comes at a time when Australia’s housing sector is booming. House prices have surged as buyers take advantage of low mortgage prices. This trend will likely continue for a while as the shortage continues. Data released today showed that building approvals declined by 7.1% in May after falling by 5% in April. Private house approvals declined by 10.3%.
The AUD/USD is also little changed as investors reacted to the latest Services PMI data. According to Markit, the country’s Services PMI declined from 58.0 in May to 56.8 in June. At the same time, the Construction Index by AIG fell from 58.3 to 55.5.
The AUD/USD is also reacting to the latest US non-farm payrolls data that were published on Friday. The data were relatively mixed. For example, while the economy added more than 850k jobs in June, the unemployment rate rose to 5.9%. Wage growth was also slightly lower than expected. Still, the numbers provided further evidence that the labor market was tightening.
AUD/USD Technical Analysis
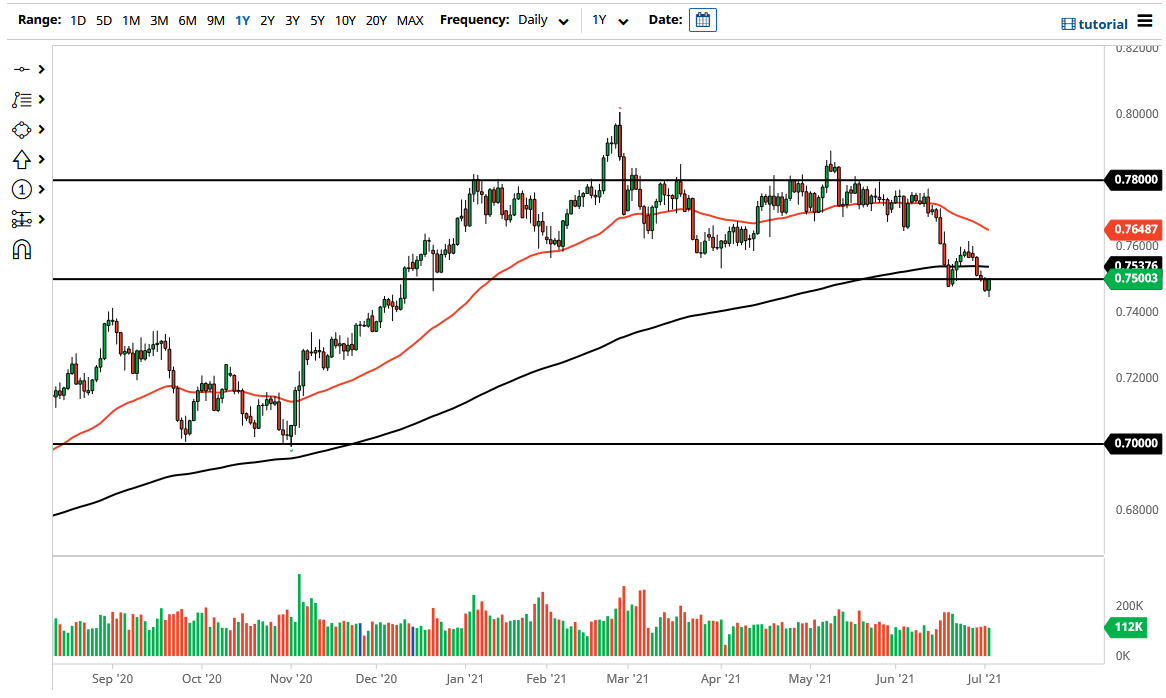
The two-hour chart shows that the AUD/USD bounced back after the latest NFP data. It rose from last week’s low of 0.7445 to a high of 0.7530. On the two-hour chart, the pair has moved slightly above the 25-day and 15-day exponential moving averages. It has also risen above the important support at 0.7463. The pair is also forming the handle section of the inverted cup and handle pattern. Therefore, the pair will likely resume the downward trend since this pattern is usually a sign of bearish continuation.


