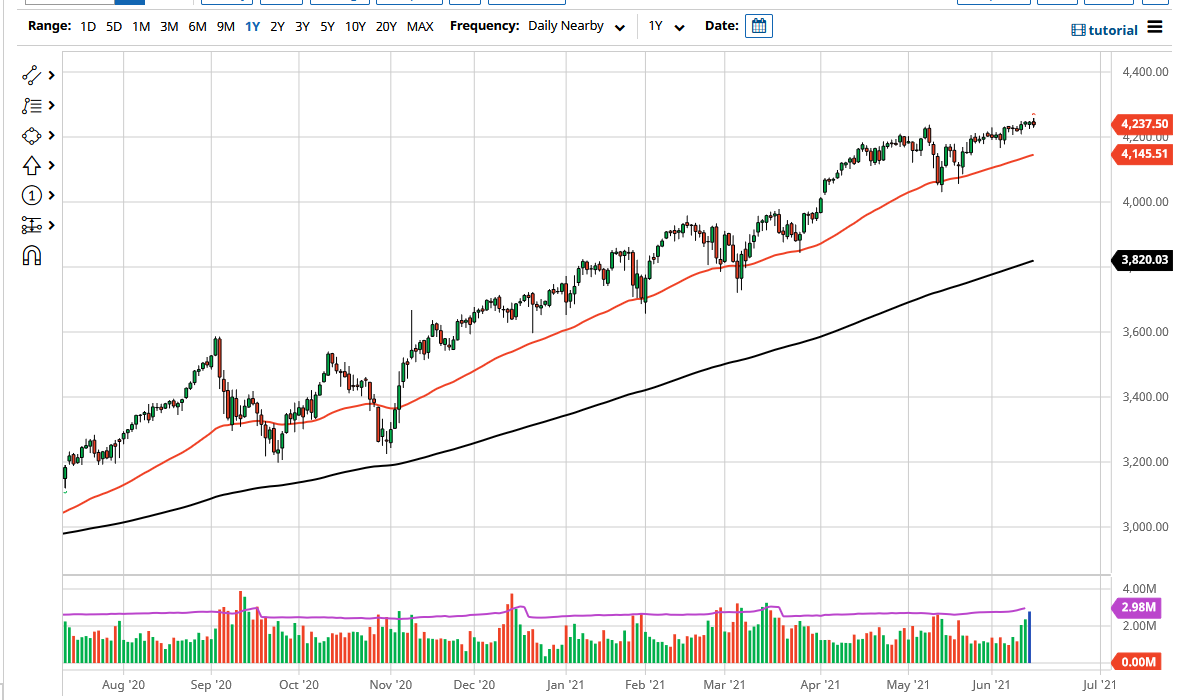
The S&P 500 was relatively quiet during the trading session on Tuesday as traders wait for the Wednesday announcement from the Federal Reserve. The statement that comes out late during the day should throw a lot of volatility into this market, but in the short term, I think a lot of people are trying to keep the risk to a minimum.
Underneath, the 4200 level is an area that we need to pay close attention to, as it is a large, round, psychologically significant figure, and an area where we had seen previous resistance. That being said, the market is likely to pay close attention to it, especially as the 50-day EMA is starting to reach towards it. The 50-day EMA is rising at a nice slope, and as you can see, it has offered support more than once. Because of this, the 50-day EMA looks as if it is offering a bit of a trendline, and I think the market will continue to respect it.
If we were to break down below the 50-day EMA, then I believe the market will go looking towards the 4000 handle, which I see as the “floor in the market.” The 4000 level also features a gap, which will attract a certain amount of attention. If we were to break down below the 4000 handle, then I think we probably will go looking towards the 200-day EMA, and at that point I would be a buyer of puts, but not willing to short the market straight out due to the fact that the Federal Reserve could very well say something to turn the market right back around in some type of meltdown mode. After all, the Federal Reserve steps in to pick up the S&P 500 every time it drops about 10% or more.
On the other hand, if we turn around and break above the top of the candlestick for the trading session on Tuesday, then it looks as if the market could go looking towards the 4400 level. The 4400 level makes sense, as we tend to see this market move in 200-point increments, and that would be my target in the short term. If we can break above there, then the market is likely to go looking towards the 4600 level.