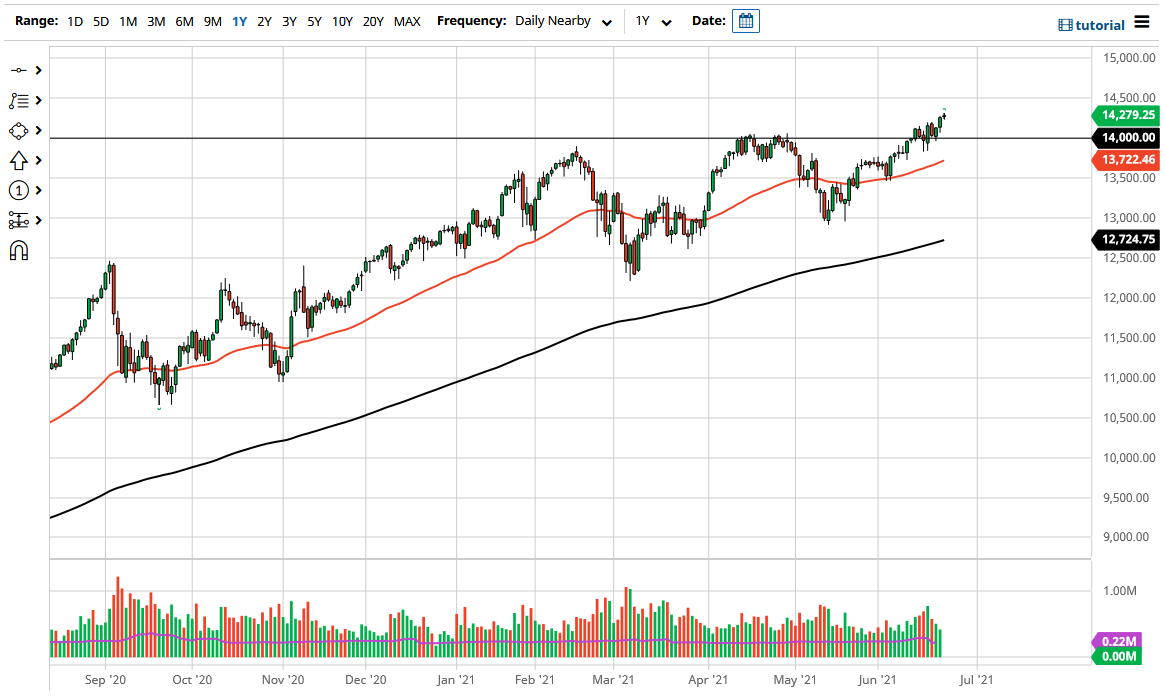
The NASDAQ 100 rallied just a bit during the trading session on Wednesday as we continue to make new highs. Ultimately, the market looks as if it is leaving the 14,000 level in its wake, and now will probably look at that general vicinity as a floor in the market. We are very much in an uptrend, and that clearly has not changed. In fact, I think what we are looking at is a potential rotation play, as traders are starting to look at growth again over value.
At this point, the market will probably continue to try to reach towards the 14,500 level and as high as the 15,000 level based upon the massive consolidation that we are just now starting to break out of. There was support at 13,000 and resistance at 14,000, and depending on how you draw the lines, you can either come up with a rectangle or an ascending triangle. The good news is that it does not really matter which shape you choose, because it measures for the same target going forward.
To the downside, even if we were to break down, it is likely that we could find support at the 50-day EMA underneath even if we do get a little bit of a breakdown. The 50-day EMA is sitting at the 13,725 level and sloping higher. That is a bullish sign as well, and because of all of the technical indicators just below, it is only a matter of time before the uptrend continues. I also recognize that the 15,000 level above would be a significant resistance barrier due to the psychology of a number like that. If we can break above that level, then the market is probably going to continue the longer-term uptrend that we have seen based upon liquidity and the overall “risk-on attitude” of markets in general.
Keep in mind that the central banks continue to flood the markets of liquidity, and that will continue to show itself in stocks overall. There is no scenario in which I would be a seller, but if we did break down below the 200-day EMA, then I might be a buyer of puts. Beyond that, that is about as bearish as I get when it comes to trading this index.