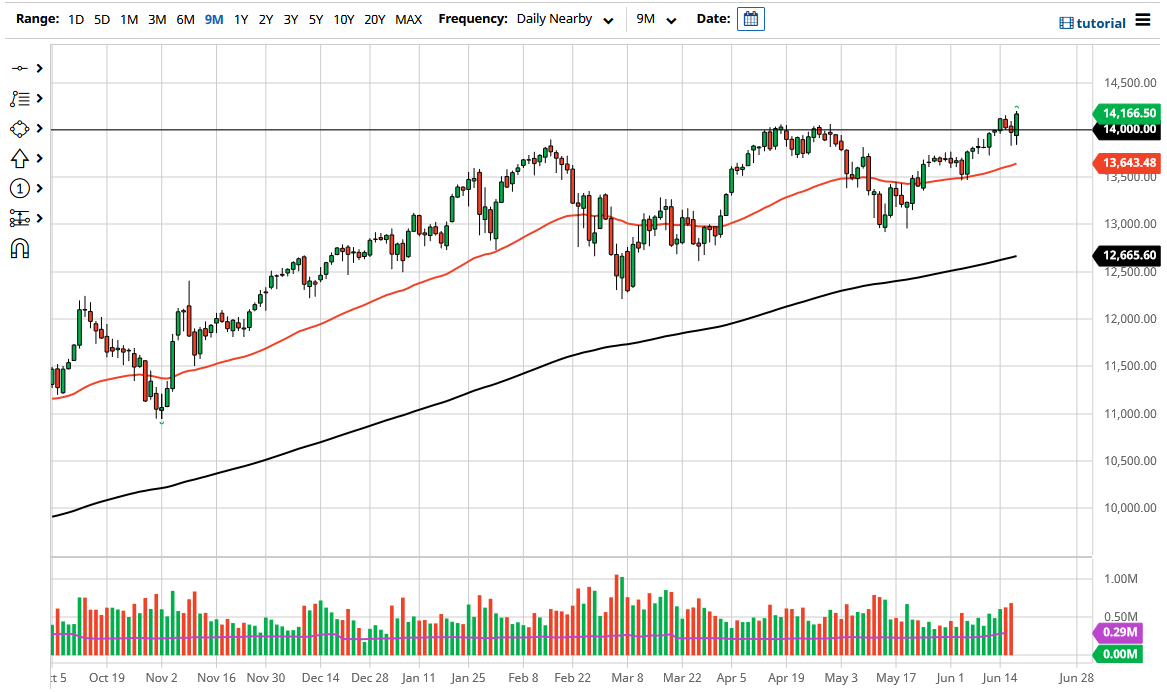
The NASDAQ 100 initially sold off during the trading session on Thursday as traders continue to throw tantrums about the Federal Reserve and their plans of possibly tapering a bit sometime in the next couple of years. That being said, as interest rates dropped, which of course was unexpected, technology stocks got a huge boost as the NASDAQ 100 ended up at an all-time high. Because of this, the market is likely to continue seeing buyers come back in and pick up value as it occurs.
The 14,000 level being broken through a couple of times of course makes a good sign of strength, and therefore I think what we will see is short-term volatility but a longer-term return to the overall bullish attitude. Underneath, we have the 50 day EMA near the 13,650 region, and that could offer a significant amount of support right along with the 13,500 level underneath there. All things been equal, I think those areas both will offer enough support to continue to push this market higher.
To the downside, if we were to break down below the 13,500 level, then it is possible that we could see the market looking towards the 13,000 level underneath. The 200 day EMA is reaching towards that area, so I think that is essentially where you end the trend if we do rollover. Looking at this chart, that seems to be very unlikely, so I believe that we are more likely to see 14,500 than 13,500. If we can break above the 14,500 level, then we can go looking towards the psychologically important 15,000 level, an area that has been my longer-term target for a while. I think that this is just the “monthly freak out” that we tend to get in the markets overall, and therefore I look at this as a potential buying opportunity now that a lot of the weak hands have been shaken out of the markets overall.
Buying on the dips continues to be the best way going forward from what I can see, as I would look to be very cautious about position size and simply add to those positions once the market starts to take off to the upside. I would anticipate that 15,000 will be very difficult, so I am not concerned about trying to ride the wave above there at this point.

