The difference between success and failure in Forex trading is very likely to depend mostly upon which currency pairs you choose to trade each week and in which direction, and not on the exact trading methods you might use to determine trade entries and exits.
When starting the trading week, it is a good idea to look at the big picture of what is developing in the market as a whole and how such developments and affected by macro fundamentals and market sentiment.
It is not an especially good time to be trading markets right now, as there are only a few valid long-term trends to exploit.
Big Picture 13th June 2021
Last week’s Forex market saw the strongest rise in the relative value of the Swiss franc and the strongest fall in the relative value of the New Zealand dollar. However, the values were so small as to be practically irrelevant. It was a relatively quiet week in the Forex market.
I wrote in my previous piece last week that the best trades were likely to be being short of the USD/ZAR currency pair. Unfortunately, the USD/ZAR currency pair rose by 1.02% over the week.
Fundamental Analysis & Market Sentiment
The headline takeaway from last week was the higher-than-anticipated US inflation data, which is now running at an annualized rate of 5%, the highest seen in more than a quarter of a century. This data had little effect on the Forex market or the U.S. dollar particularly, but did send the U.S. stock market higher to end the week at an all-time high closing price. We are seeing a mixed picture across other markets, with fewer clear trends surviving. The U.S. dollar now seems to have the greatest long-term strength amongst major currencies, while the Japanese yen has the most long-term weakness. The changing inflation picture in the U.S. may now cause a significant boost to the greenback as expectations of faster rate hikes are more likely to develop.
Last week also saw monthly policy releases from the European Central Bank and the Bank of Canada. These contained no surprises or rate adjustments and had little impact on the Forex market.
The main events this coming week will be the U.S. FOMC Statement, Projections and Federal Funds Rate, plus major monthly policy inputs from the Bank of Japan and the Swiss National Bank. There will also be releases concerning U.S. retail sales, British and Canadian inflation, and New Zealand GDP. It will almost certainly be a high-impact week compared to the last few weeks.
Last week saw the global number of confirmed new coronavirus cases and deaths fall for the sixth week running, suggesting that the most recent wave which saw a new record daily high has peaked globally. It is likely that the extensive vaccination campaigns seen mostly in more advanced economies has contributed significantly to this situation. Approximately 12% of the global population has received at least one vaccination.
Excepting extremely small nations, the fastest progress towards herd immunity has taken place in Canada, Israel, Iceland, Bhutan, the U.K. and Chile, which have each inoculated more than 60% of their respective populations. Immunization is now proceeding more quickly in the European Union than it is in the U.S. although the U.S. is ahead of the E.U. with 52% of its population having received at least one shot of a vaccine, while the E.U. has vaccinated 44% of its population. A few nations are about to begin vaccinating older children.
The strongest growth in new confirmed coronavirus cases right now is happening in Afghanistan, Algeria, Bangladesh, Cuba, Fiji, Guatemala, Honduras, Indonesia, Kuwait, Mongolia, Oman, Panama, Russia, South Africa, Tunisia, and the U.A.E.
Technical Analysis
U.S. Dollar Index
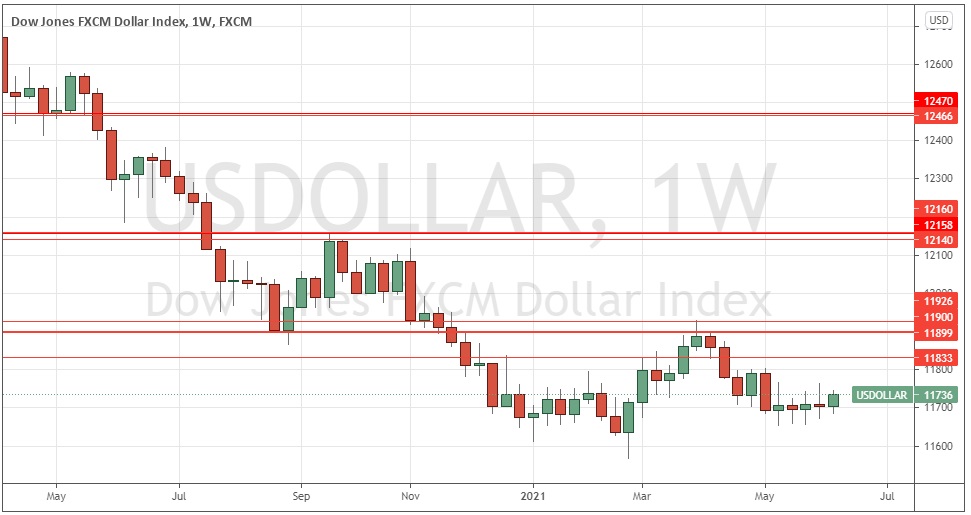
The weekly price chart below shows that the U.S. Dollar Index printed a small bullish engulfing candlestick last week. This is a bullish sign, as is the fact that the price action has now invalidated the resistance level identified at 11716. However, the index is still below its prices from both six and three months ago, which shows that a long-term bearish trend persists in the greenback. Overall, next week’s price movement in the U.S. dollar looks slightly more likely to be upwards than downwards. This suggests that trades long of the USD against other currencies are most likely to be appropriate over this coming week.

S&P 500 Index
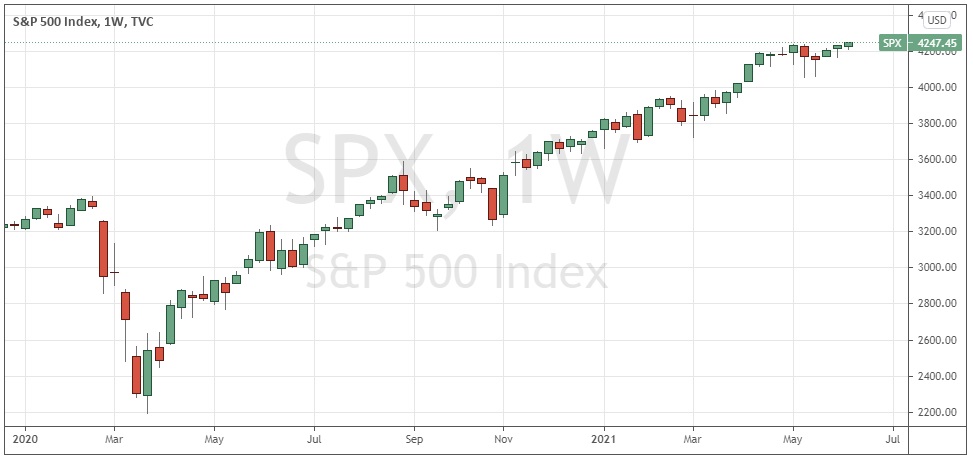
This major U.S. benchmark equity index has risen again to reach both a new all-time high price at 4250, and to close at a record high weekly close. This index has enjoyed a strong long bias for decades and has a track record of advancing more strongly when it is breaking to new high prices, as it is now. Bulls may wish to wait for a daily (New York) close above 4250 before entering any long trade, but if this happens, the price will be more likely than not to rise further. We have strong multi-month bullish momentum here.

WTI Crude Oil
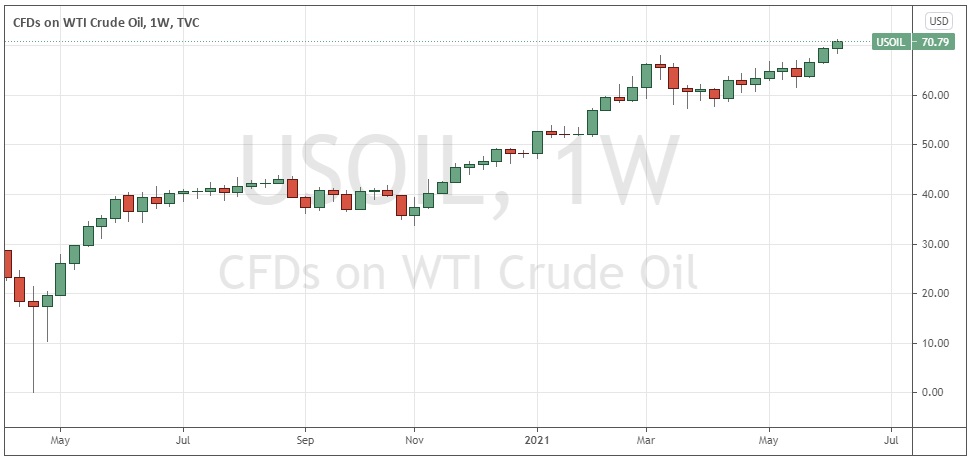
Although WTI Crude Oil does not have a good track record of respecting its own price momentum, the chart below shows we have seen a firm and persistent long-term bullish trend in crude oil ever since the initial recovery from the coronavirus price collapse seen in April 2020. The strong long-term bullish trend has now seen bulls push the price above the big round number at $70 which had been seen as a potential technical barrier. Continuing strong post-corona economic growth in many major economies is fueling demand for WTI Crude Oil, so this may be a worthwhile buy again over the coming week.

Bottom Line
I see the best likely opportunities in the financial markets this week as being long of the S&P 500 Index following a daily (New York) close below 4250, and of being long of WTI Crude Oil.
