Bullish View
- Buy the BTC/USD and set a take-profit at 44,000.
- Add a stop-loss at 38,000.
- Timeline: 1-2 days.
Bearish View
- Set a sell-stop at 38,000 and a take-profit at 35,000.
- Add a stop-loss at 40,000.
The BTC/USD rose to a key resistance level after some positive comments by Elon Musk and billionaire Paul Tudor Jones. Bitcoin is trading at $40,388, which is about 30% above the lowest level in May.
Bitcoin Rises to Key Resistance
BTC started the week on an upbeat tone as investors reacted to a tweet reply by Elon Musk. In it, he said that Tesla will reconsider accepting Bitcoin when it is proven that 50% of miners have transitioned to clean energy.
The price then received more support from Paul Jones, the founder of the Robin Hood Foundation. Jones is one of the most respected hedge fund managers who made a fortune during the 2008/9 global financial crisis. In an interview with CNBC, he said that he was buying the cryptocurrency because of the Fed policies.
The BTC/USD is rising as traders remain optimistic that the Federal Reserve will remain accommodative in the meeting that will start today. The bank is expected to leave interest rates at a record low of between 0% and 0.25%. It is also expected to commit itself to more quantitative easing. In the statement, analysts will be watching out for the term “transitory” that the bank used to describe the current recovery process.
The Fed decision comes at a time when data from the United States has been relatively strong. The labour market is tightening, with many companies struggling to find workers. The number of Americans filing for initial jobless claims has also dropped to a post-pandemic low. Further, inflation has risen to the highest level in a decade while the House Price Index (HPI) has popped.
The BTC/USD is also rising after it emerged that outflows in Bitcoin funds have started slowing down after falling substantially in the past two months.
BTC/USD Technical Analysis
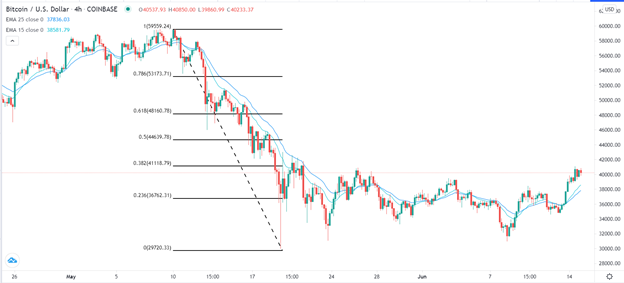
The four-hour chart shows that the BTC/USD has formed an inverted head and shoulders pattern. In technical analysis, this is usually a signal that the price will bounce back, especially if it manages to move above the important resistance at 40,000. The pair has also moved above the 25-day and 15-day moving averages. The two have also made a bullish crossover pattern. It is also slightly below the important 38.2% Fibonacci retracement level. Therefore, the pair may keep rising as bulls target the 50% retracement level at 44,640.

