Bearish View
- Sell BTC/USD and add a take-profit at 30,000.
- Add a stop-loss at 35,000.
- Timeline: 1 day.
Bullish View
- Set a buy stop at 35,000 and a take-profit at 38,000.
- Add a stop-loss at 32,000.
The BTC/USD price retreated sharply in the overnight session as traders continued to wait for the upcoming US inflation data. Bitcoin dropped to $33,085, which was the lowest level since May 30.
Bitcoin Price Falls Ahead of Inflation Data
On Thursday, the US will publish the latest inflation numbers. Analysts expect the data to show that the overall Consumer Price Index (CPI) rose to 4.7% in May as the US recovered and commodity prices surged.
In the past few weeks, the prices of key commodities like lumber, gasoline, and copper have surged to the highest levels in years. Analysts also see the core CPI that excludes the volatile food and energy prices rising above 3%.
Inflation affects Bitcoin prices because of its role in interest rates since it forms part of the Fed’s dual mandate. Therefore, if inflation rises at a time when the labor market is tightening, there is a possibility that the Fed will be under pressure to hike interest rates. In a statement during the weekend, Janet Yellen, the former Fed chair and current Treasury secretary, argued that the Fed ought to boost interest rates.
The BTC/USD also declined after a report said that the US government had managed to recover most of the funds paid to Colonial Pipeline hackers. The Russian hackers were paid in Bitcoin, raising concerns about the privacy nature of Bitcoin transactions.
Meanwhile, in a report on Monday, MicroStrategy, the company managed by Michael Saylor said that it was borrowing another $400 million to buy Bitcoin. The firm said that it was taking a $284 million charge related to its cryptocurrency losses this quarter.
BTC/USD Technical Analysis
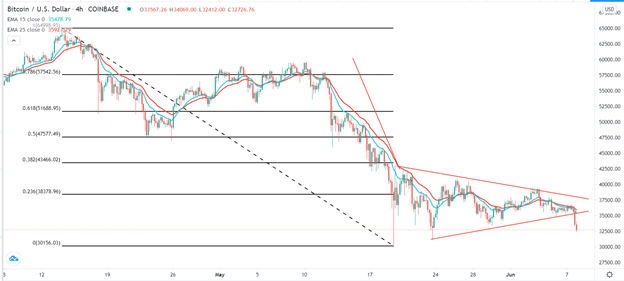
The four-hour chart shows that the BTC/USD pair has been under intense pressure lately. The coin has dropped by more than 50% from its highest level on record. The pair moved below the lower line of the bearish pennant pattern that is shown in black. It also moved below the 23.6% Fibonacci retracement level and the short and longer-term moving averages.
Therefore, after this bearish breakout, the pair will likely keep falling as bears attempt to move below May’s low of below $30,000. Any drop below $30,000 will be a sign that bears have prevailed and that they will start targeting the next key support at $25,000. However, a bounce above the 23.6% retracement level will invalidate the bearish view.

