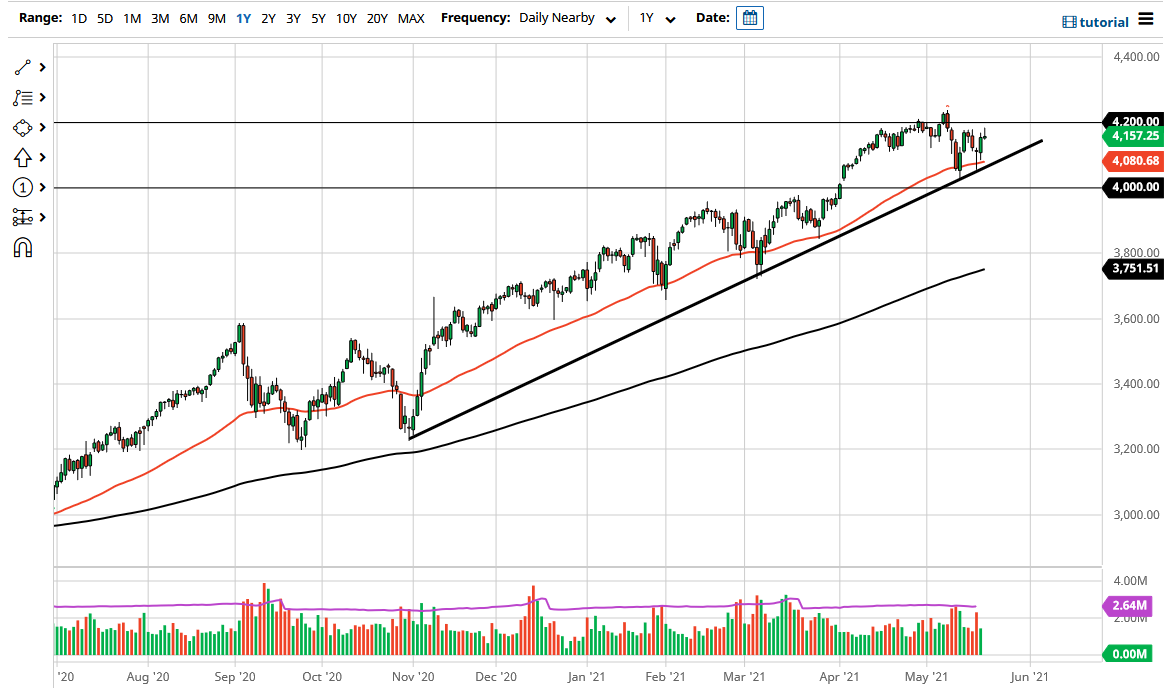
The S&P 500 rallied a bit during the trading session on Friday only to turn around and sell off just below the 4200 level. The 4200 level has been crucial resistance previously, so I think it is only a matter of time before we would challenge it again. In fact, we have done it several times and now I think the market is continuing to “chip away” at the selling pressure.
If we can break out to a fresh, new high, then the market is likely to continue to go higher, perhaps reaching towards the 4400 level. Breaking above that would be a positive sign, and it is likely that we would continue to see a market that will go much higher. The momentum continues to pick up on the breakout, due to the fact that we have been so noisy as of late.
The 50-day EMA underneath sits at the 4080 handle and has been respected until now. The uptrend line sits just below there as well, so I think ultimately you would have to look at any pullback as a potential buying opportunity, and I suspect that a lot of people will be looking at this market as such. Even if we break down below the uptrend line, then the 4000 level could be a target. The 4000 level is a large, round, psychologically significant figure and an area that had previously been resistive. Furthermore, there is also a massive gap that sits there, so it certainly looks as if the buyers would be willing to get involved.
A breakdown below the 4000 level could open up the possibility of a move down to the 3800 level, which sits just above the 200-day EMA. The 200-day EMA is a significant indicator that a lot of people will be paying attention to for the trend, so breaking down below that would probably be very negative and could unwind this market drastically. I do not think that will happen, but it is very likely that we would see something rather drastic if it does happen. This is a market that I think will continue to go higher in general. The S&P 500 continues to find reasons to go higher, so I do not think anything has changed.