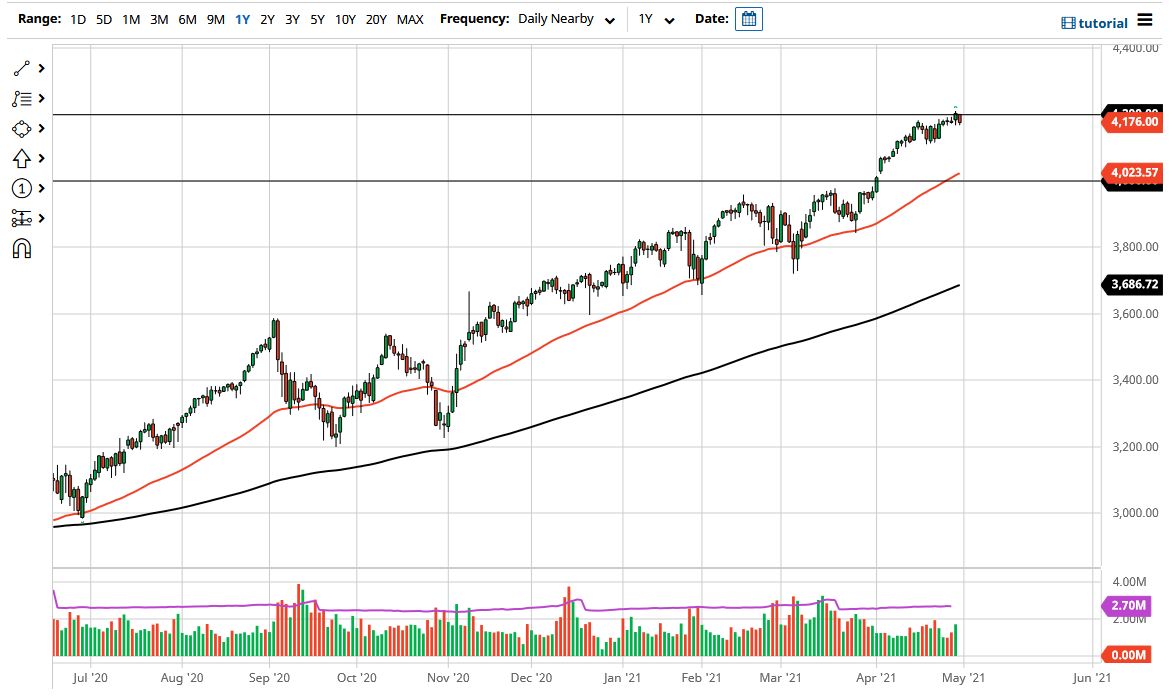
The S&P 500 pulled back a bit during the trading session on Friday to show the 4200 level as being resistive again, as we have seen this level cause headaches for traders. That being said, we are in the midst of earnings season, so it should not be a huge surprise that we have struggled at this point as the markets have produced good numbers, but perhaps the market also ran far too ahead of itself heading into these earnings. Nonetheless, we will eventually find some type of catalyst to go higher, if for no other reason than we have been in an uptrend.
Once we break above the 4200 level, it is likely that we will go looking towards the 4400 level, as the S&P 500 tends to move in 200-point increments. A pullback from here also sees a lot of support at the 200 points below, especially near the 4000 level as there is a big gap there, and the round figure itself can be supportive, and the fact that the 50-day EMA that sits just above there also adds credence to the idea. At this point, it is likely that we will continue to see plenty of buyers looking for value.
Central banks around the world continue to flood the markets with liquidity, so it makes sense that we could see the markets continue to see inflows due to the fact that the reopening trade is coming, and yields simply do not offer enough of a return for people to do anything other than to buy riskier assets such as stocks. Furthermore, we also have to look at the idea of the market having quite a bit of momentum and liquidity being pumped into it, so this is a market that cannot be shorted. If we break down below the 4000 level, then it is possible that we could go to the 200-day EMA, which is a massive indicator that a lot of traders look at as dynamic support and a trend-defining object. I believe that the market is likely going to continue to see buyers coming in trying to take advantage of momentum, and now that earnings season is getting passed by, we should see more of the same.