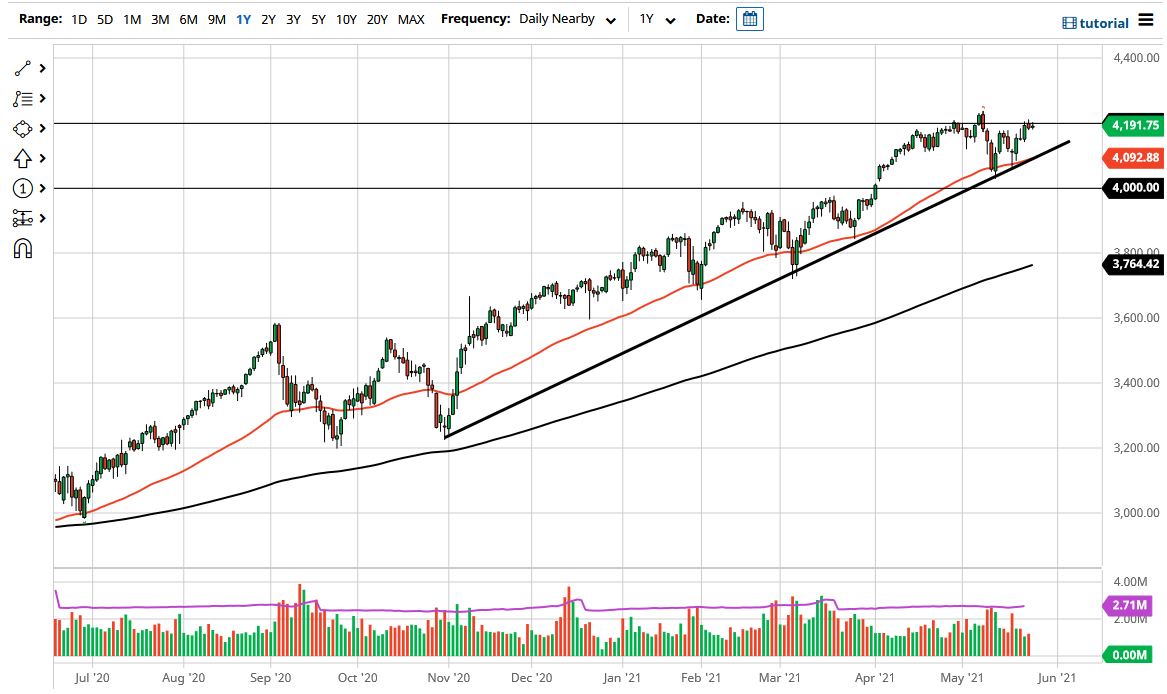
The S&P 500 did very little during the trading session on Wednesday, as we are sitting just below the 4200 level. The 4200 level is an area where we have seen a lot of selling pressure over the last couple of months, and continues to be a major issue. If we can break above the 4225 handle, then I think we are ready to go much higher. At that point, I would anticipate a move to the 4400 level, but right now it seems as if we are just running out of momentum. With this lack of momentum, the old adage “sell in May and go away” comes to mind.
We are entering the slowest time of the year, and volatility has fallen off of a cliff. Typically, that is a very good sign and the markets rally. At this point, the market is likely to go looking towards the uptrend line underneath and the 50-day EMA that is walking right along that support level as well. We are in an uptrend, though, and we are likely to see little bits and pieces of support underneath to keep this market going higher. Even if we were to break down below the uptrend line, the market also has massive support just above the 4000 handle in the form of a gap that has yet to be filled. It is not until we break down below there that I would even begin to think that the market is rolling over.
If we were to break down below the 4000 handle, I would be a buyer of puts, as I would anticipate that the market could go down towards the 3800 level where the 200-day EMA is racing towards. That will attract a certain amount of attention, so I would anticipate that the market will turn right back around at that point. With the liquidity measures that continue to be a major factor in the stock markets, I think it is almost impossible to consider shorting, so I look at dips as potential value opportunities more than anything else. Ultimately, you can also look at this as a recent “W pattern” that has bounced from the 50-day EMA.