The difference between success and failure in Forex trading is very likely to depend mostly upon which currency pairs you choose to trade each week and in which direction, and not on the exact trading methods you might use to determine trade entries and exits.
When starting the trading week, it is a good idea to look at the big picture of what is developing in the market as a whole and how such developments and affected by macro fundamentals and market sentiment.
It is a good time to be trading markets right now, as there are several valid long-term bullish trends in major U.S. stock market indices which can be traded at most Forex brokers as CFDs, as well as long-term momentum in favor of the Canadian dollar, gold, and the euro against the U.S. dollar.
Big Picture 9th May 2021
Last week’s Forex market saw the strongest rise in the relative value of the Canadian dollar and the strongest fall in the relative value of the U.S. dollar.
I wrote in my previous piece last week that the best trade was likely to be long of the S&P 500 following a daily (New York) close above 4220, and to be long of the CAD/JPY currency cross. We did not get a close above 4220 in the S&P 500 Index until Friday, but the CAD/JPY cross rose over the week by 0.65%, giving an average win of 0.33%.
Fundamental Analysis & Market Sentiment
The headline takeaway from last week was the surprisingly low number of new non-farm payroll jobs created over the past month in the U.S., which came in at only 266k compared to the consensus forecast of 990k, while the unemployment rate is now 6.1% compared to the 5.8% which had been expected. This hit the U.S. dollar hard and boosted a range of assets against the greenback, including the euro, gold, the Canadian dollar, and the U.S. stock market, which closed Friday at an all-time high.
The U.S. dollar may now be more vulnerable going forward as the Federal Reserve is unwilling to discuss tapering its bond purchase program, although other central banks are beginning to do so. We are now seeing evidence that the pace of growth in the U.S. is nothing special in global terms, but the weakness of the dollar we saw on Friday was able to lift the stock market, so it would be overstating things to say there is pessimism on the economy: risk-on sentiment survives.
Apart from U.S. non-farm payrolls data, we also saw poor Canadian jobs data (although that had little impact on the very strong Canadian dollar, which continued to advance over the past week), and a policy release from the Bank of England which saw much stronger U.K. growth forecast by the Bank (which also had little impact upon the value of the pound).
The main events this coming week will be releases of U.S. inflation data and retail sales. In terms of scheduled high impact data releases, it will be a relatively quiet week.
Last week saw the global number of confirmed new coronavirus cases fall for the first time in ten weeks, suggesting that the current wave which saw a new record daily high may have peaked globally. Total confirmed coronavirus deaths also fell.
Despite the global dip, the coronavirus situation remains very serious in India, with the country reporting a record number of new cases and deaths over the weekend. There is mounting evidence that the official data seriously underestimates the number of new cases and deaths while may well be double the official tally or even greater. There are concerns that the very high rate of infections in India could lead to the incubation of new mutations resistant to vaccines, although Pfizer are optimistic that their current vaccine offers a very high level of protection against any mutations identified so far.
Many countries have begun vaccination programs. Excepting extremely small nations, the fastest progress towards herd immunity has taken place in Israel, the U.K. and the U.A.E. Immunization is now proceeding more quickly in the European Union than it is in the U.S., although the U.S. is ahead of the E.U. with 45% of its population having received at least one shot of a vaccine.
The strongest growth in new confirmed coronavirus cases is happening in Afghanistan, Algeria, Bolivia, Egypt, India, Japan, Lithuania, Malaysia, Nepal, Sri Lanka, Trinidad, Uzbekistan, and Vietnam.
Technical Analysis
U.S. Dollar Index
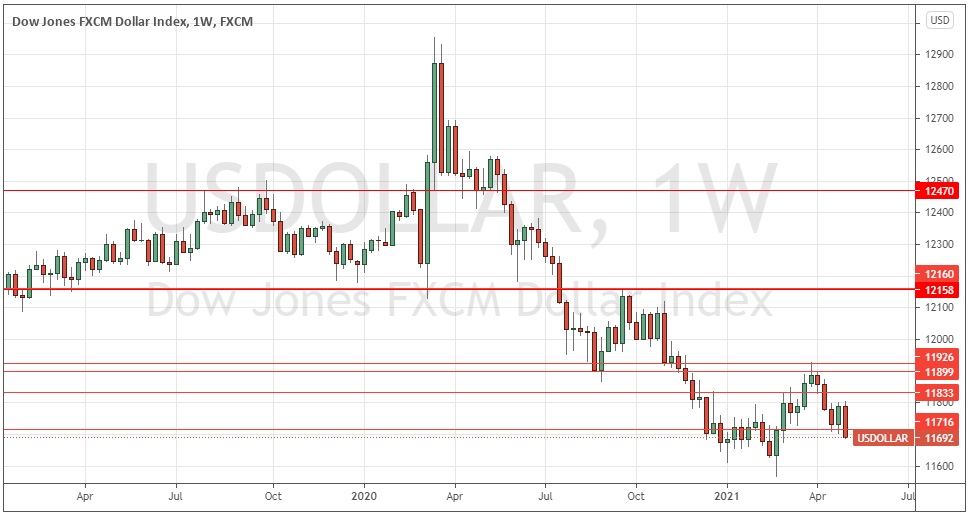
The weekly price chart below shows the U.S. Dollar Index printed a bearish outside candlestick last week which closed below an existing key support level at 11716. These are bearish signs. The index is now below its prices from both three and six months ago, which is also a bearish sign. The greenback sold off strongly on Friday as disappointing U.S. non-farm payroll numbers were released. Overall, next week’s price movement in the U.S. dollar looks likely to be downwards, especially as it is likely momentum from Friday will carry over into at least the early part of this coming week. For this reason, it will probably be wise to not take any long USD trades over the coming week.

S&P 500 Index
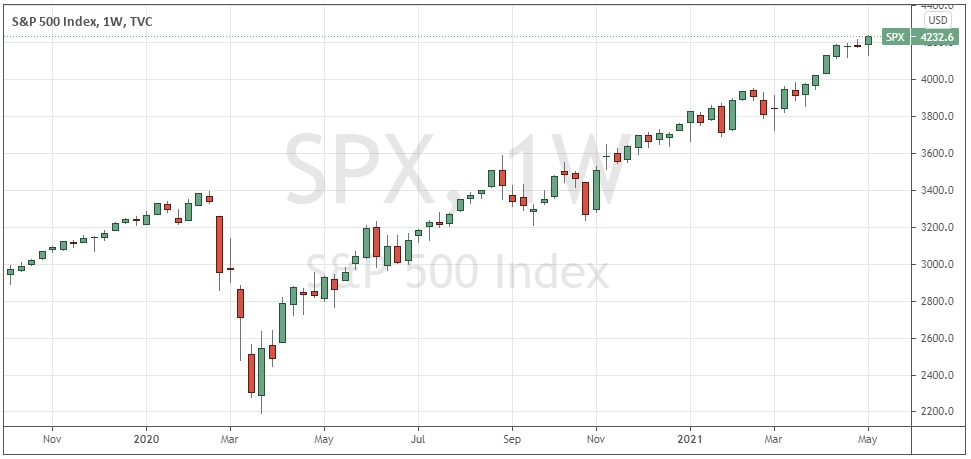
The incredible rise of the U.S. stock market since the initial impact of the coronavirus in March 2020 continues, with the price rallying respectably to a new all-time high closing price last Friday after holding mostly steady during the earlier part of last week. As we have now had a daily close above 4220, the price is back in blue sky with bullish momentum, which suggests that a further advance in price is likely over the coming days this week.

USD/CAD
Although the Canadian dollar does not have a good track record of respecting its own price momentum, the chart below shows we have seen a firm and persistent long-term bullish trend in the Loonie ever since the initial recovery from the coronavirus price shock of March 2020. Last week again saw a strong bearish candlestick which closed right on the low of its range, with this currency pair now at a 3.5-year low price. We can therefore say there is a strong long-term bearish trend although bears should be cautious of the big round number at 1.2000.
.jpg)
Gold
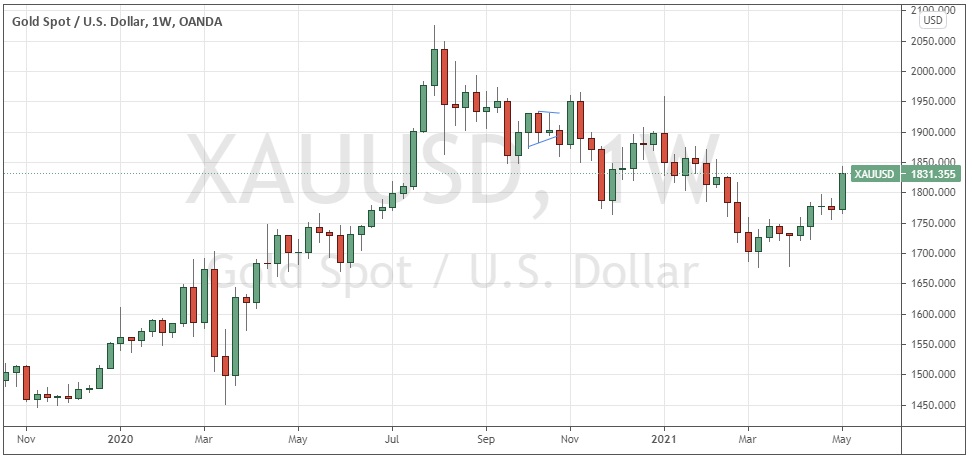
Gold saw a firm advance during the second half of last week to reach a new 50-day high price. The price is now higher than it was 3 months ago which is normally a good measure of a bullish trend. Although the breakout here is not especially strong, gold does have a good historical record on the long side when it begins to break to new long-term highs. Another factor in favor of this breakout is that it happened after a multi-day consolidation period, which tends to strengthen the momentum of any eventual breakout.

EUR/USD
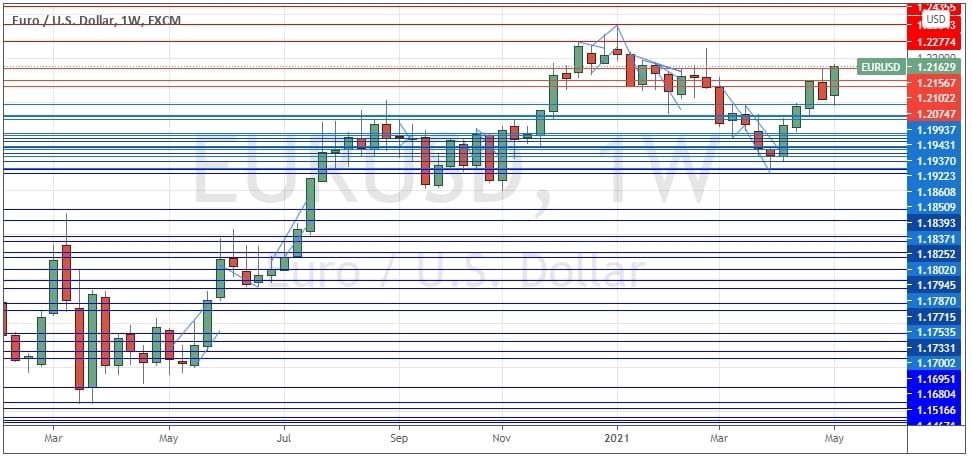
The EUR/USD currency pair rose strongly Friday on well above-average volatility to close at a new 50-day high. The price is likely to rise higher, especially on Monday, and over the rest of the week, although it has not quite reached its recent high just above 1.2200. The pair last produced a firm bullish engulfing candlestick and there is clearly a bullish long-term trend, both of which are bullish signs.

Bottom Line
I see the best likely opportunities in the financial markets this week as being long of the S&P 500 Index, short of the USD/CAD currency pair, long of the EUR/USD currency pair, and long of gold in USD terms following a daily close above $1831.
