Three weeks ago, gold was underperforming in the face of positive US data and a lack of inflationary surprises. The US indices (S&P 500, Dow Jones Industrial) were either at, or a little off, their record highs (Russell 2000, Nasdaq 100). Basic materials, transportation and real estate were outperforming, and bond yields were cooling off.
As far as US Equities go, the trends we outlined in late March appear to be holding true in April. The S&P 500 continues to grind higher, currently sitting at a record 4185. The same is true of the Dow Jones Industrial Average, currently at 34200. A notable difference is that the Nasdaq 100 has caught up and also broken its former highs, currently at 14041, leaving only the Russell to range some 5% off its March highs.
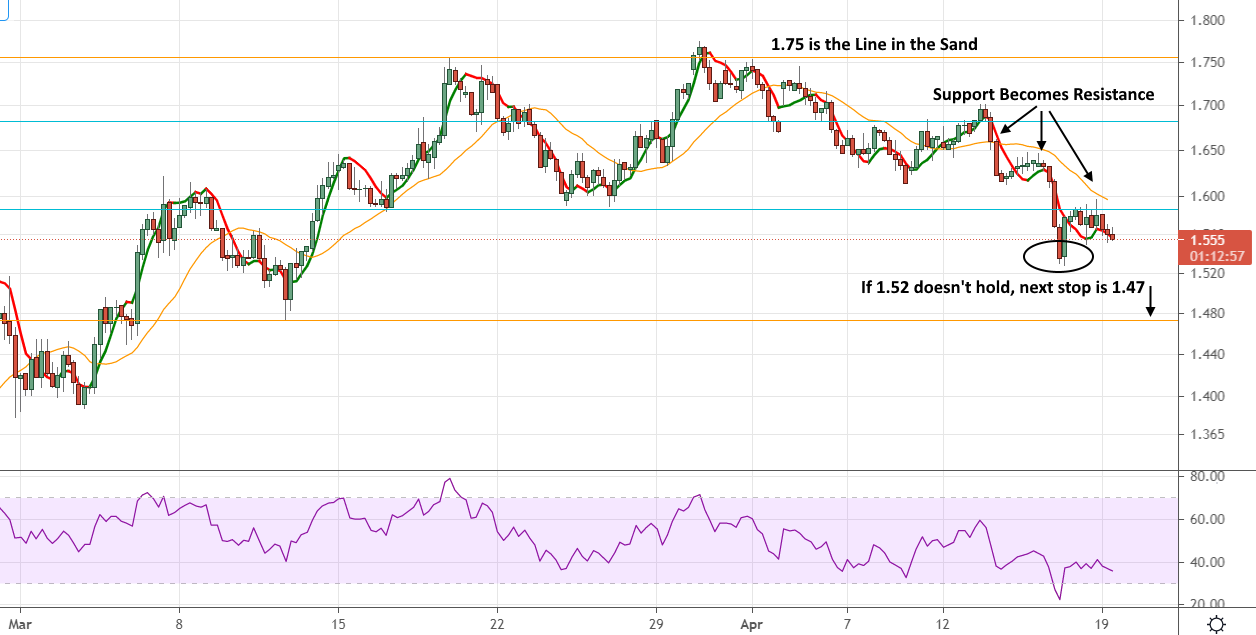
At the time, we outlined that the most likely next stop for US 10-year yields would be a retest of the 1.58 level and that the path of least resistance for gold would be to regress back to $1672, rather than heading back up to challenge the double-top at around $1964.
Technical Targets Met
US 10-year yields have broken below the 20-day moving average and gone down to test the previous double-bottom at 1.58. Thursday, April 15 saw them dipping below this level and bumping up against it as resistance for the rest of the week. Monday has seen them opening just below it and selling off from there. They are currently at 1.562. For the time being, it would seem that 1.75 has established itself as a line in the sand the market is not yet willing to cross, which appears to be lending further fuel to markets across the risk spectrum.

10-Year Bond Yields Continue to Slide
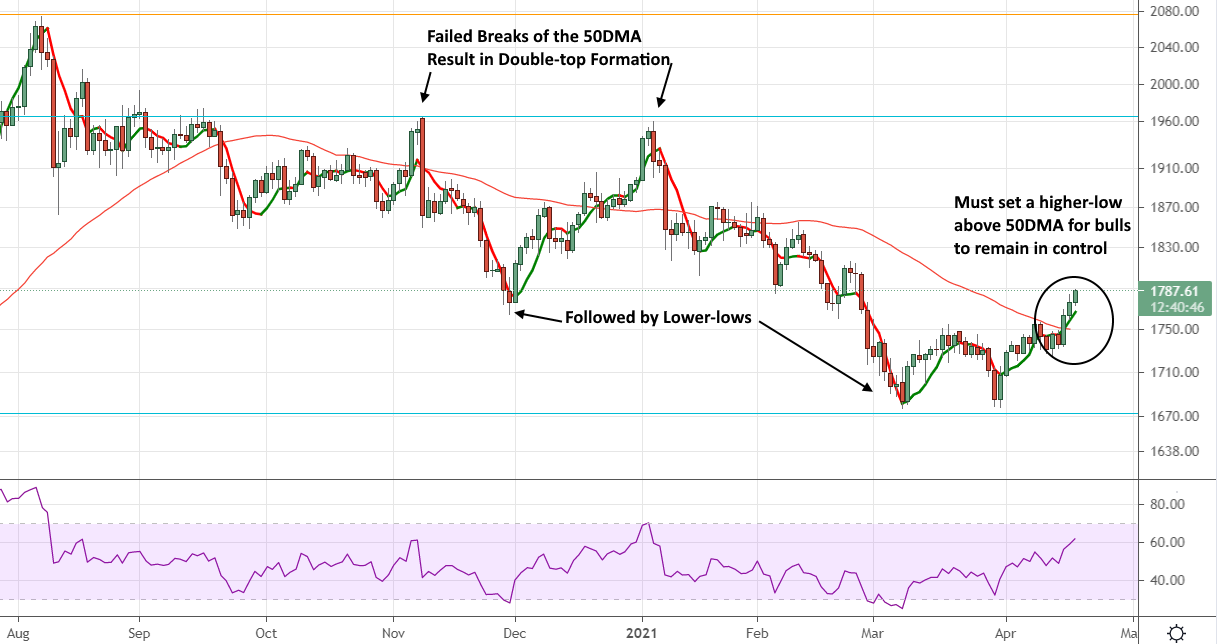
As far as gold goes, the retrace and retest of the high 1600s also played out as broadly expected. The price didn’t go all the way down to $1672, but it did touch the $1676 level we saw on March 8 and closed a touch above the March 8-9 closes of $1684. What’s really interesting, however, is the strength of the dip-buying at that $1684 level.

Gold Finds Support
Gold Bulls Take Control
The yellow metal has since broken to higher-highs, touching $1758 on April 8 and then breaking even higher with three consecutive bullish closes taking it up to $1775. Monday’s opening has seen it surging even higher, trading at $1787 at the time of writing.

Higher Low Above 50DMA Required
What we now have is an interesting situation for gold, which appears not so much buoyed by future inflation expectations as by falling bond yields and a favourable technical picture. As things currently stand, the bears have taken a back seat in gold markets while bond yields appear to have further down to go before establishing support.
In the short term, it’s important that the gold price closes above the December low of $1762 if the bulls are to keep the upper hand. In the medium term, it’s absolutely crucial for the gold bulls to set a higher-low above the 50-day moving average, which is currently around $1750. This will send a broader signal that gold may be prepared to regain some of the ground it has lost in 2021 to other hard assets.
