Bearish View
- Set a sell-stop at 1.3900 (25 EMA).
- Add a take-profit at 1.3822 (22nd April low).
- Set a stop-loss at 1.3978.
- Timeline: 1-2 days.
Bullish View
- Set a buy-stop at 1.3978 and a take-profit at 1.4050.
- Add a stop-loss at 1.3900.
The GBP/USD is up for the fifth consecutive day as the market digests the latest Federal Open Market Commission (FOMC) interest rate decision. It rose to 1.3978, which is 2% above the lowest level in April.
Fed Decision in Focus
The GBP/USD pair has rallied this week as investors remain hopeful about the UK economy. This is after data revealed that the country is on a faster recovery than what most analysts were expecting. Retail sales have surged while the crucial services sector is growing at a faster rate than expected. The employment numbers are also relatively better than in other countries. However, this is happening at the expense of the country’s national debt, which has risen sharply recently.
The biggest focus on the GBP/USD this week was the Fed decision that happened on Wednesday. The bank left interest rates unchanged and hinted that they could remain there for a few more years. It will also continue buying asset purchases at the pace of $120 billion per month in a bid to help the recovery.
The dovish Fed decision came at a time when the US economy is on a faster pace of recovery. Corporate earnings from most companies like Apple, Microsoft, Facebook and Tesla have surged. Retail sales have grown by almost 10% while inflation has risen to more than 2.5%.
Later today, the GBP/USD will react to the first estimate of US GDP data that will come out in the American trading session. Most economists expect the data to show that the GDP grew by 2.5% in the first quarter after rising by 1.9% in the fourth quarter of last year. This growth will be mostly because of higher consumer spending because of the stimulus package. The US will also publish the latest pending home sales data and initial jobless claims.
GBP/USD Forecast
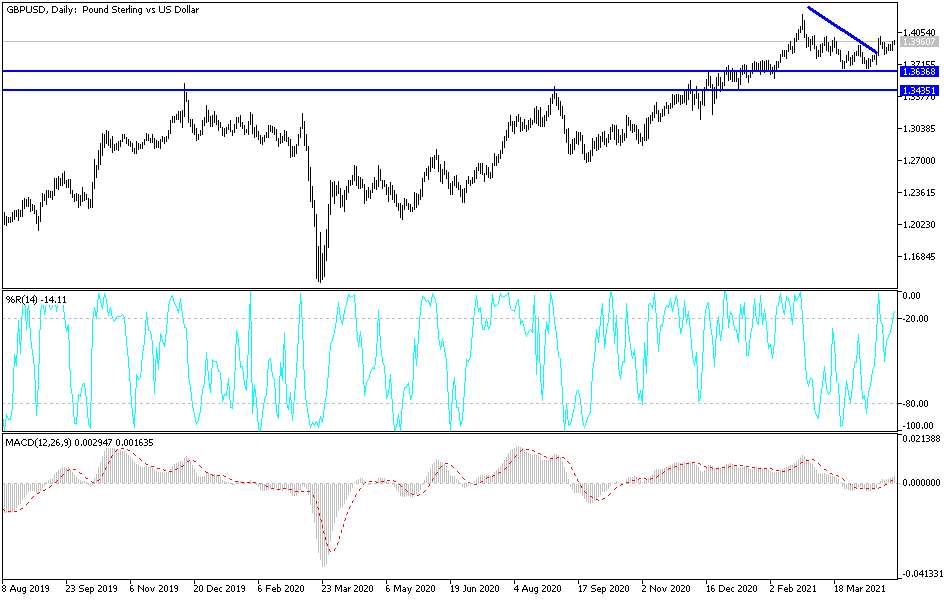
The four-hour chart shows that the GBP/USD pair broke out higher after the FOMC decision. It rose to a high of 1.3978, which was the highest level since April 20. The pair seems to be forming a head and shoulders pattern that is usually a bearish sign. It is also slightly above the 25-day and 15-day moving averages. Further, it moved above the small ascending channel that is shown in black. Therefore, the pair may retreat as the market fades the dovish Fed data.

