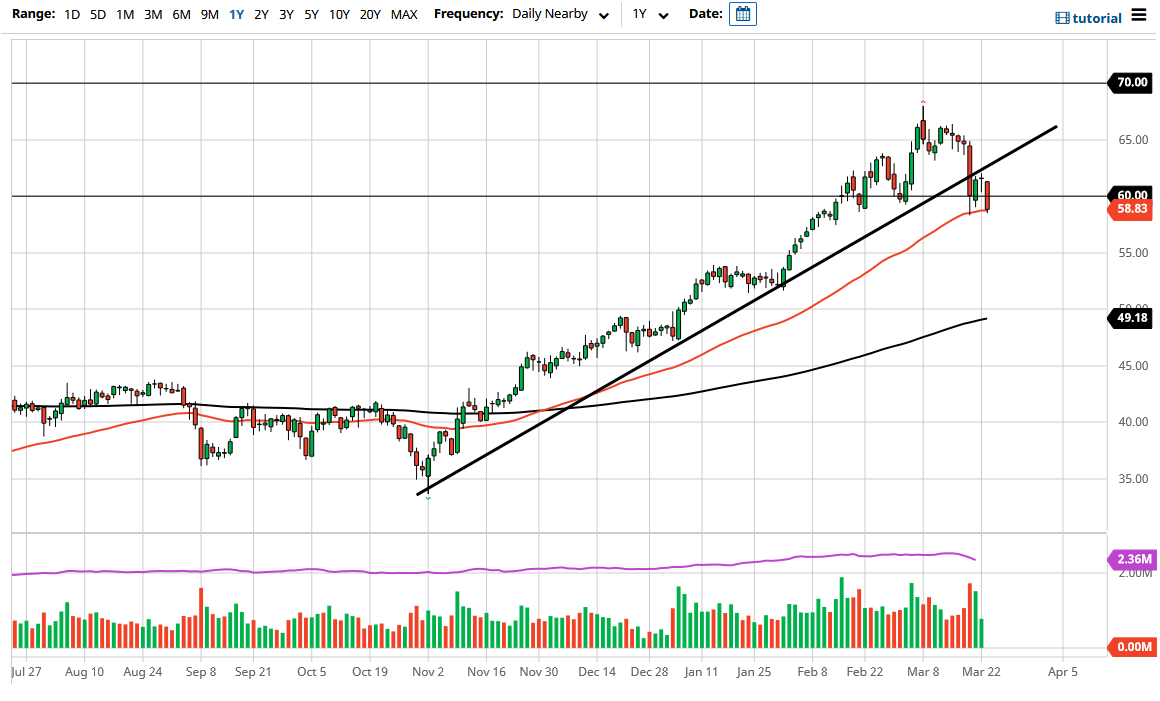
The West Texas Intermediate Crude Oil market has dropped rather significantly during the trading session on Tuesday again, slicing through the 50 day EMA. If you remember, the Thursday candlestick from last week at one point was a loss of over 9%, and I stated that those types of selloffs rarely happen as a “one-off.” This is exactly what I had been thinking that eventually we would see another shot lower. Clearly, we are well below the 50 day EMA, and I think that a lot of people will be looking to get short of this market.
Where we go to next is a bit of an open-ended question, but I would not be surprised at all to see this market test the $55 level, and then eventually the $53 level. After all, we just broke not only a major EMA, but we have broken below a significant uptrend line that has been in play three or four months now. Now that trendline is out of the way, and a lot of different traders will be seeing this as a potential trend change. Whether or not it is an actual trend change may be a completely different question but at the very least I think you are looking at a decent pullback.
Another thing that leads me to believe that we have further downside is the fact that we close that the very bottom of the candlestick, which typically means that you will get a certain amount of follow-through. Because of this, I am looking towards short-term charts to start selling again or perhaps just simply a break below the bottom of the daily candlestick. Again, I do not know how much further we go to the downside but $53 seems to be where the structural support is according to the recent trading.
Yields in the United States of course are rising in general, and that suggests that perhaps we will continue to see a strengthening US dollar, which of course works against the value of crude oil over the longer term as well. That being said, I think we have further to go to the downside regardless, but it is not until we break down below the $52 level that I would be concerned about the overall trend. I think this is just a nice corrective wave that has been overdue.

