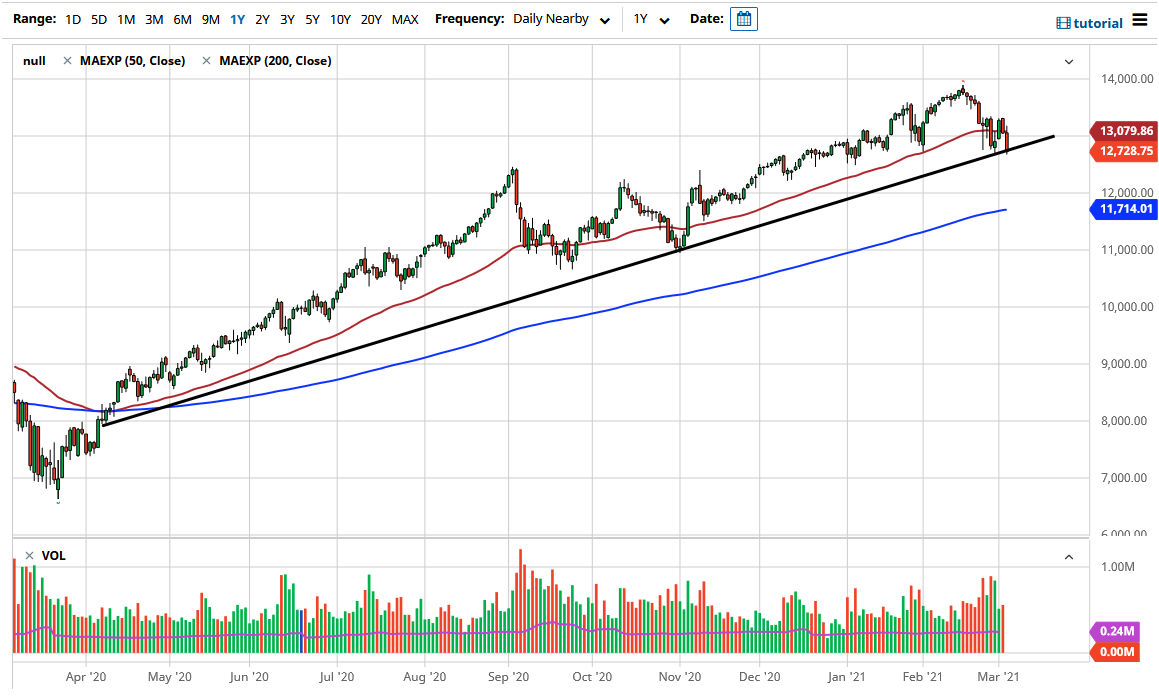
The NASDAQ 100 got absolutely crushed during the trading session on Wednesday again, as traders begin to worry about the job situation in the United States. A less-than-enthusiastic ADP announcement came out and had people thinking that perhaps the recovery was not moving in the right direction. The fact that we are closing towards the bottom of the candlestick is a bad sign as well, so I think that if we break down below the 12,600 level, we could see a bit of an extension to the downside. At that point, we could go to the 12,500 level to be followed towards the 12,000 level.
The 12,000 level is crucial to pay attention to, not only due to the fact that it was previous resistance, but we also have the 200-day EMA approaching that level. The 200-day EMA will attract a certain amount of attention, and if we were to break down below there, then it is likely that we would see an even more impulsive correction. At that point, though, I would not be short of the NASDAQ 100, rather I be looking at buying puts if anything.
It is worth noting that the 50-day EMA is starting to tilt a little bit lower, but perhaps more importantly, we have the jobs number coming out on Friday and that will have a major effect on the markets in general. The market will be very volatile, so you have to keep in mind that anything could happen on Friday, so Thursday will probably be somewhat quiet. However, pay close attention to the yields in the 10-year note, because if they suddenly spike that will drive this market much lower.
There is a bit of a rotation going on as well, so the big tech companies might not be the best place to be, and then in general we could see the NASDAQ 100 struggle a bit due to the fact that it is so heavily slanted towards a handful of stocks. To the upside, if we can break above the 13,333 level, then it opens up the possibility of going to the 14,000 level which is still a longer-term target of mine. The next couple of days could be somewhat choppy though, and therefore caution is advised.