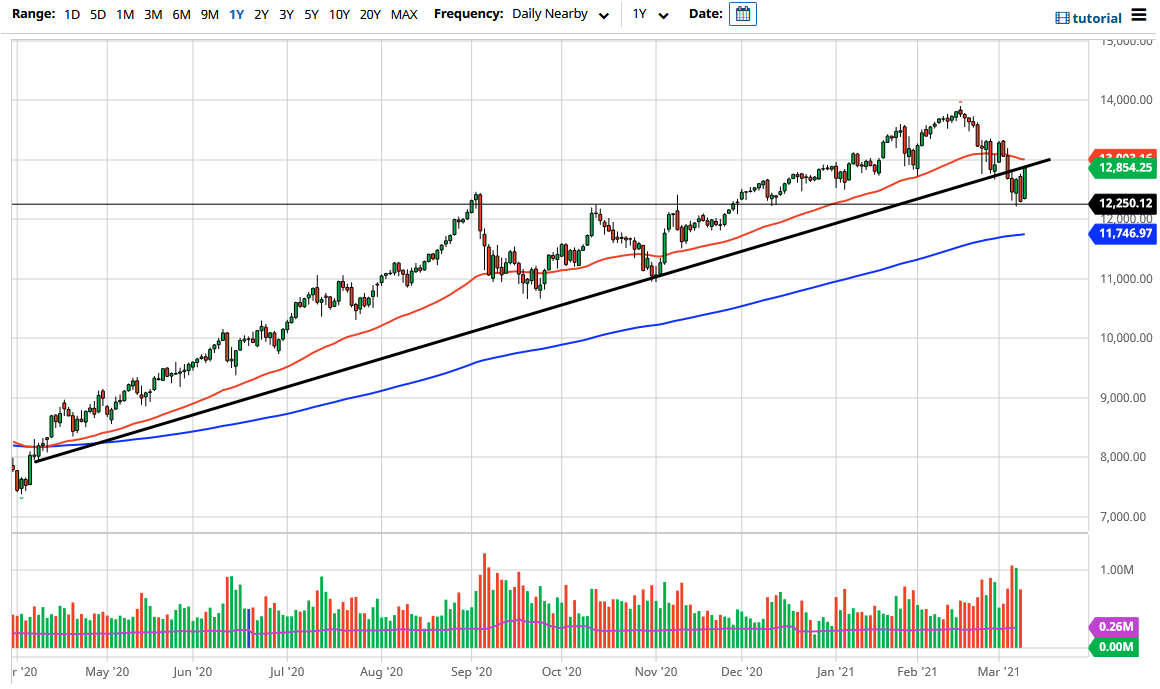
The NASDAQ 100 shot straight up in the air during the trading session as yields fell in the United States on Tuesday. We have bounced from the crucial 12,250 level, which is an area where we have seen a lot of action at as of late. It previously was both support and resistance, so it is not a huge surprise that it has attracted the attention of a lot of traders. As those yields fell in the bond market, it had people looking for growth stocks again, and that almost always means the NASDAQ 100.
Underneath the 4250 level we also have the 12,000 handle, which will attract a lot of attention and after that the 200-day EMA. In other words, even if we do break down in the NASDAQ 100, it is going to be very noisy and choppy on the way down. If we can finally break down below the 200-day EMA, then I would be a buyer of puts because I believe that point, we would have further to go.
On the other hand, if we can turn around and take out the 50-day EMA which is sitting at the 13,000 handle, which is a large, round, psychologically significant figure, a lot of people would be in there trying to chase momentum. Furthermore, the 13,330 level is the next target and breaking above there opens up the possibility of a move all the way to the 14,000 handle. However, we need to see bond markets stabilize and then people will be willing to step in to bring those yields down. It is only a matter of time before the Federal Reserve does something to get involved and push the market in the “correct direction”, so given enough time we will see this market break out. With that being the case, this candlestick for the Tuesday session is most certainly a great sign, but the fact that we gained over 4% tells me that we could very well pull back in the short term in order to build up more momentum. We have a lot of decisions to make over the next couple of days and I think that we could see another trend form soon.