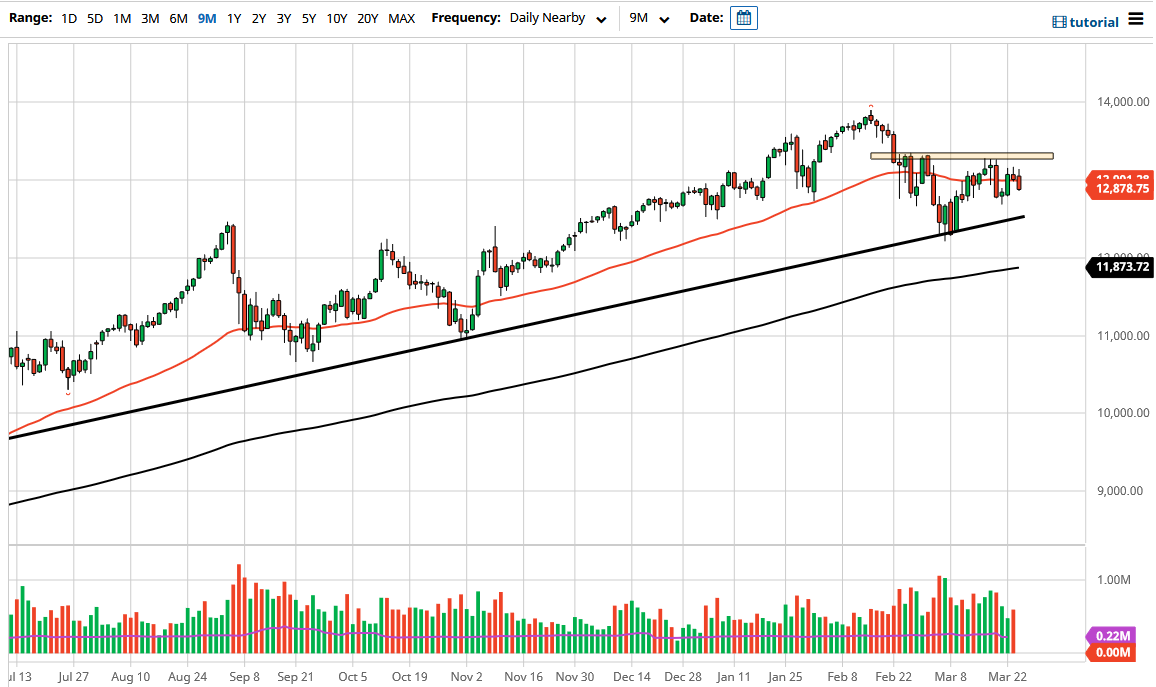
The NASDAQ 100 had initially tried to rally during the trading session on Wednesday but has given back the gains as the NASDAQ was closing towards the bottom of the range for the trading session. That being said, it looks as if the 50 day EMA is starting offer a significant amount of resistance, but we have multiple areas underneath that could offer supportive action, so that something that you should keep in the back of your mind as you look at the chart.
The hammer that formed during the Friday session offers a bit of support to begin with, but even after that we have a significant uptrend line underneath that should continue to offer plenty of support. Breaking down below there could open up a little bit bigger of a move, and if that happens then I would be looking to buy puts. After all, you cannot simply short US indices for anything more than a short-term trade, because we have seen multiple times that the Federal Reserve or government officials will get involved and support the market if they fall too far. However, by purchasing puts, you can mitigate your potential losses, and therefore you do not get your head handed to you.
On the other hand, if we turn around and broke higher than we would probably go looking towards the 13,333 level. Breaking above that level then it would be a very bullish sign as it would complete a potential “inverted head and shoulders”, which of course has bullish connotations as well. In fact, the market would more than likely go looking towards the 14,333 level due to the “measured move.” That being said, the market is likely to see a lot of support down at that uptrend line, so all things being equal I think it is only a matter of time before buyers get involved based upon value.
Nonetheless, I still believe that the NASDAQ 100 is going to underperform other indices in the United States are not necessarily overly excited to start buying anyway. If yields in America start to drop, that can help the NASDAQ 100 as a lot of the highflying growth companies will do well in that type of trading environment. One thing I think you can count on is a lot of volatility, so keep your position size reasonable.