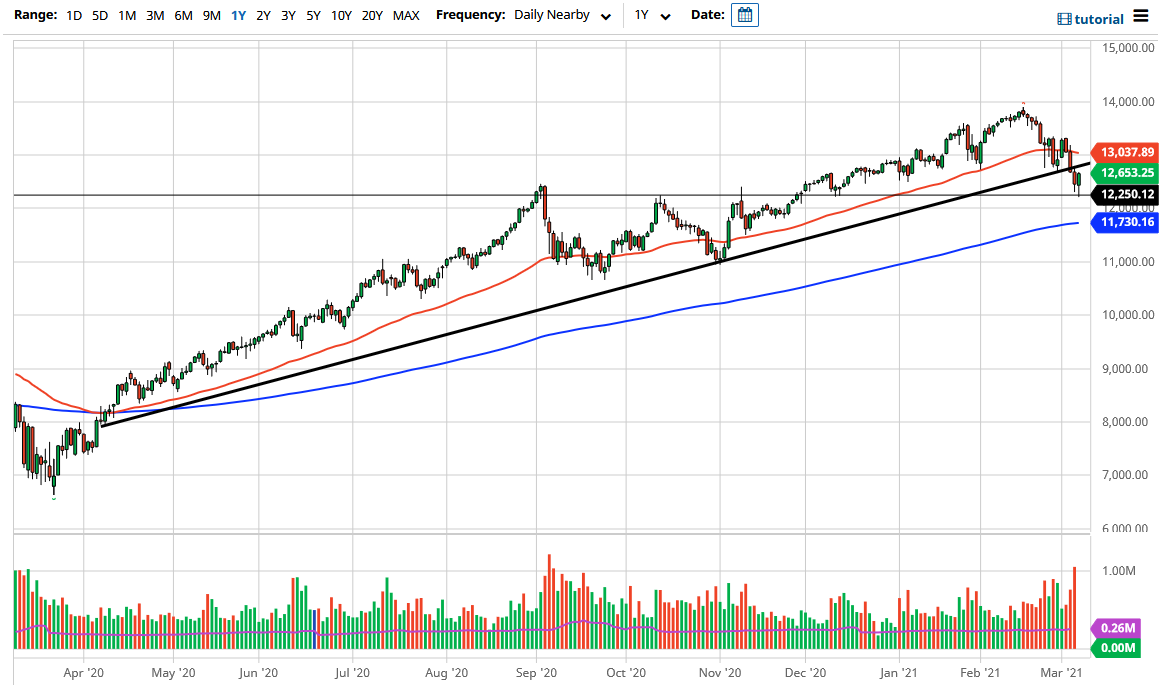
The NASDAQ 100 fell a bit during the trading session to reach down towards the $12,250 level, only to turn around and form a hammer as the market had an extraordinarily big turnaround. This is a very good sign, considering that we had recently broken through a major trend line. You can see that I have left the trend line on the chart, because I do believe that it is only a matter of time before that trendline comes back into play. After all, if we were to recapture the trend line, then it would be a very bullish sign.
However, on the downside, we have the $12,250 level, which is offering a significant amount of support. If we were to break down below that level, it could open up a move down to the $12,000 handle, perhaps the 200-day EMA. Nonetheless, it certainly looks as if the market is trying to find its footing, and if we can get some type of momentum going, this is a market that could rally rather significantly. The most recent problems have been that there has been a major sector rotation, but more importantly the interest rates have been rising in the bond markets. That is typically a toxic issue for the markets, so I think it is probably going to continue to be something that has a major influence.
You need to pay attention to the 10-year note, because if those rates do sell off, that will be like a rocket fuel for the stock market in general. I do believe that the NASDAQ 100 is more likely to recover here than it is to fall apart, but that does not necessarily mean that it is going to be easy to get to the upside. Even if we did break down below the 200-day EMA, at that point I would be a buyer of puts, not necessarily looking to short this market. Every time somebody got the bright idea to push this market lower, you probably saw more losers than winners because the market turns around and rips to the upside due to government interference, or more likely, central bank interference. Loose monetary policy will continue to push stocks higher over the longer term.