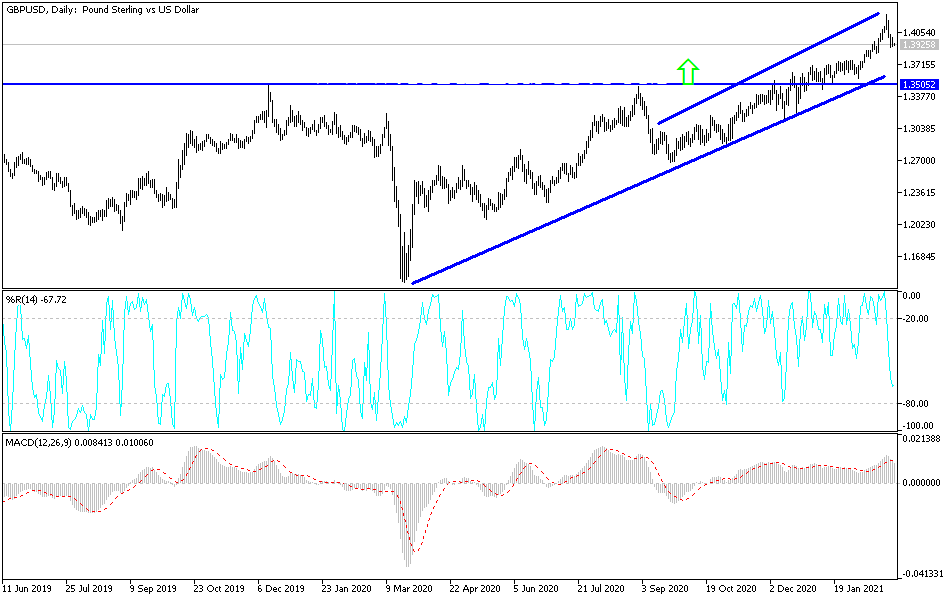
The British pound initially tried to rally during the trading session on Monday but found the 11 level to be resistive enough to turn things around and show signs of negativity. The market is more or less taking a breather after what had been an impulsive move, so I am not necessarily overly worried about the trend, and I believe that this is a pullback that should be bought into, and not sold.
The candlestick for the trading session is a bit of an inverted hammer, and if we were to break down below the bottom of the candlestick, it then opens up the possibility of follow-through. I think that makes sense, as yields in the United States continue to rally, which makes the US dollar a bit more attractive in general as people buy into Treasury notes and the like.
If we were to turn around and break above the top of the candlestick, it would not only be bullish due to the fact that it would be an inverted hammer kicking off, but it would also have the market breaking above the 1.40 level, which is a large, round, psychologically significant figure. When I look at this chart, I can see the bottom of the channel approaching where we are, and the 50-day EMA sits just below the bottom of that channel and is reaching towards the 1.3750 level, where we had broken out from previously. So-called “market memory” dictates that the 1.3750 level should be supportive all the way back down, and I think with the uptrend line and the 50-day EMA in the same neighborhood, it lines up pretty nicely for a bounce that could send this market back towards the highs again.
Speaking of the highs, it was massive resistance on the weekly chart, so it does make a lot of sense that we could not simply slice through the 1.42 level. In fact, I anticipate that it would take a couple of attempts to finally get through there, so this pullback is fitting. From a longer-term standpoint though, the pullback has yet to change anything from a structural standpoint in what has been a very strong uptrend.

