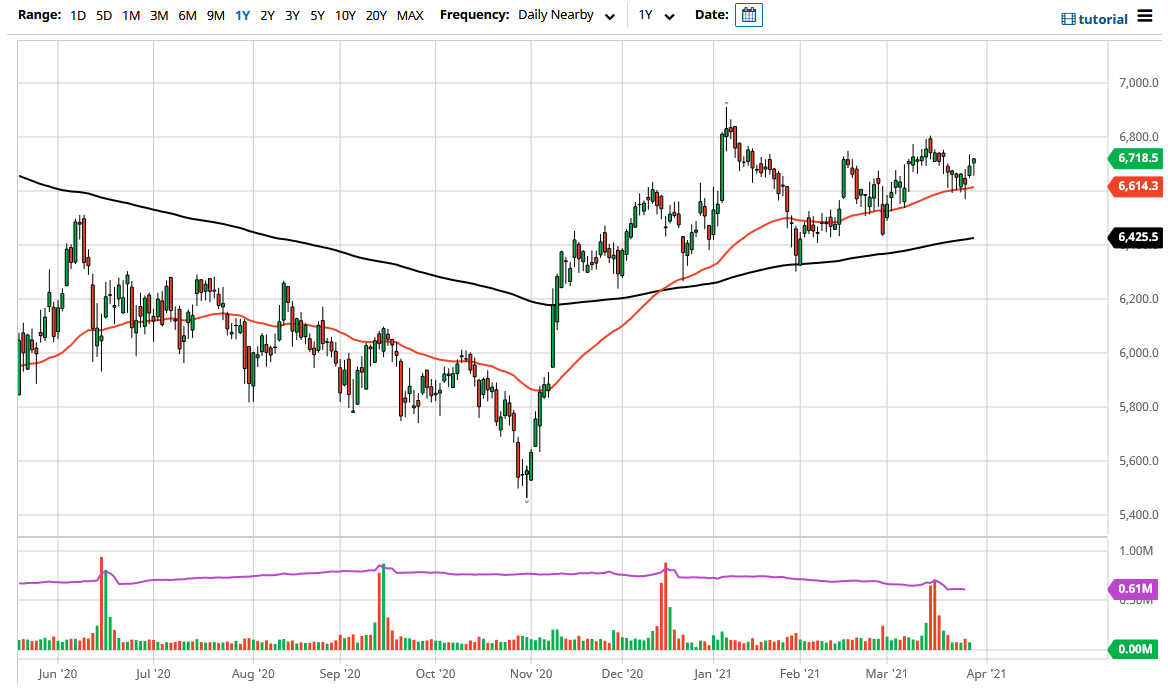
The FTSE 100 initially fell after gapping higher on Monday but found plenty of support underneath the turn around and form a bit of a bullish candlestick. By doing so, it is likely that we are going to see a bit of continuation as buyers jump back into the FTSE based upon the idea that the United Kingdom is going to outperform a lot of its peers. Adding to that theory is the idea that the vaccination efforts in the United Kingdom will continue to outpace many other economies, so the idea of course is that the UK economy opens up to normalcy much quicker.
At this point, the 50 day EMA continues offer plenty of support and therefore I think that the market is going to continue to look at that as an opportunity to get long, especially as we ended up forming a hammer from the Thursday session. All things been equal, this is a market that I think will eventually go looking towards the 6800 level above, as it is a large, round, psychologically significant figure and the most recent high that we have seen tested. Furthermore, when you look at the longer-term picture, you can make an argument for an ascending triangle that people are trying to break out of, so not only do we have a bullish looking chart, but we have a potential target based upon the measured move.
I think at this point, on a breakout above the 6800 level we would go looking towards 6900, and then eventually the psychologically significant 7000 handle. The actual measured move from the triangle itself could send this market looking towards the 7300 level. At this point, I do not have any interest in shorting the FTSE 100, but if we do break down below the 50 day EMA, I would anticipate that the market goes looking towards the 200 day EMA which is closer to the 6425 handle. With that being the case, I would be looking for value hundreds in that area as well. It is not until we break down below the 200 day EMA that I would be concerned about the longer-term uptrend, and it certainly looks at this point in time that every time we pull back there will be value hunters coming into pick this market back up yet again.