Bearish View
Sell the EUR/USD if it moves below 1.1866 (today’s low).
Add a take-profit at 1.1836 (March 9 low).
Set a stop-loss at 1.1923 (pivot point).
Bullish View
Set a buy stop at 1.1923 and a take-profit at 1.1970 (R1).
Add a stop-loss at 1.1880.
The EUR/USD is relatively unchanged as the market continues to watch the performance of the global bond market and the recent summit between China and the US. The pair dropped to 1.1866 in early trading.
Bond Yields Ease
The bond market has been a key driver for the performance of the EUR/USD price recently. Last week, the yield of the 10-year government bonds rose to 1.70% for the first time in more than a year. While the yield has dropped to 1.684% today, it is still at elevated levels. The same is true for the 30-year and 2-year government bonds.
The performance of the bond market is mostly because of the high inflation expectations among investors. Some analysts expect that the overall inflation will rise to more than 3% in the next few months because of the recent $1.9 trillion stimulus package.
In a recent interview with Bloomberg, Larry Summers, the former Treasury secretary, called the stimulus the least fiscal macroeconomic policy for the last 40 years. He also warned that the US could suffer from a prolonged stagflation, where there is slow economic growth, high unemployment, and rising prices.
The EUR/USD is also reacting to the failed talks between the US and China that were held in Alaska. China was calling for the new Biden administration to remove the tariffs placed by Donald Trump and for a reset of the relations. The US, on the other hand, insisted on diplomatic issues like Hong Kong and Taiwan.
The economic calendar will be relatively muted today. But the US will release the latest existing-home sales numbers while the German central bank will publish its monthly report.
EUR/USD Technical Outlook
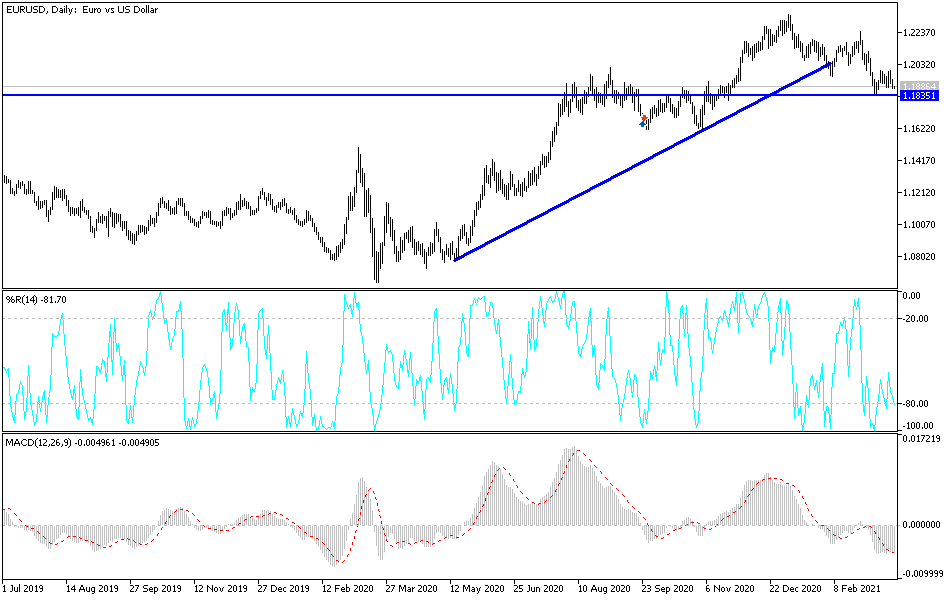
The EUR/USD pair formed a double-top pattern at 1.1989 between March 12 and March 18. The neckline for this pattern was at 1.1880. On the four-hour chart, the price has found some resistance at this neckline. It has also moved below the 25-day and 15-day weighted moving average (EMA). The price is also between the pivot and first support of the standard pivot points while the Relative Strength Index (RSI) has continued to drop.
Therefore, the price will likely keep falling as bears target first support of the pivot points at 1.1850. Any moves below that will point to another decline to 1.1800.

