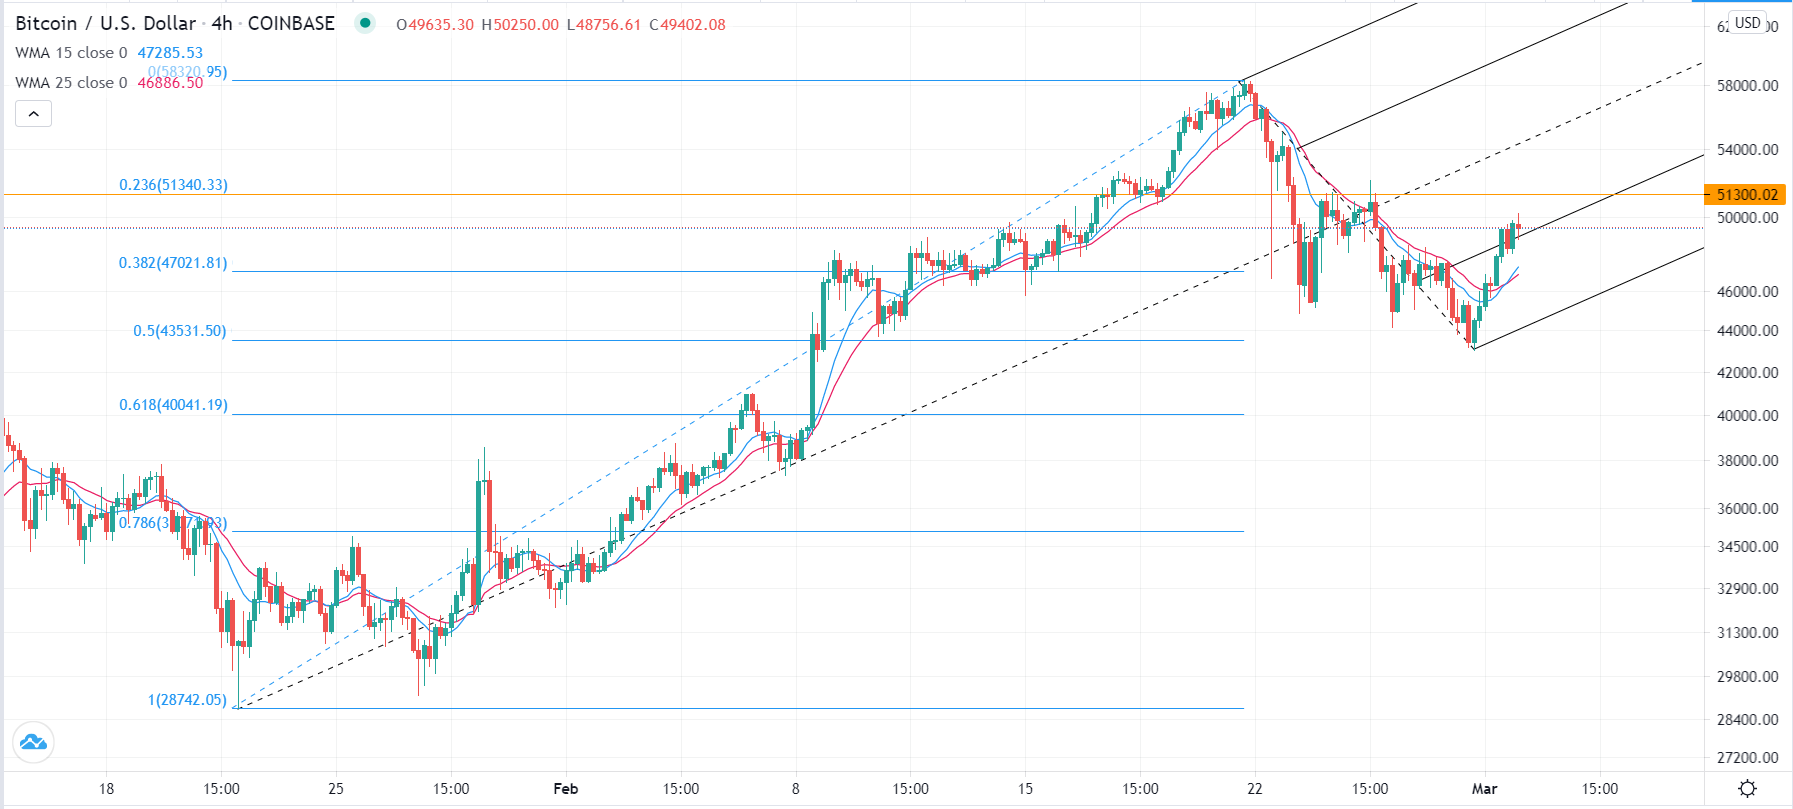
Bullish Case
Place a buy stop at $51,300 (23.6% retracement) and a take-profit at $55,000.
Add a stop loss at $50,000.
Bearish Case
Place a sell-stop at $48,000 (below first support of Andrews pitchfork).
Add a take-profit at $45,000 and a stop-loss at $51,300.
The BTC/USD rally accelerated in the overnight session as opportunistic investors rushed to buy the dip. The Bitcoin price has risen to $49,700, which is 15.63% above last week’s low of $43,000.
US Treasury Yields and Bitcoin
Last week, Bitcoin had a relatively rough week as its price dropped by more than 30% after it reached an all-time high. This price action was mostly because of the action in the US Treasuries market.
Last week, the ten-year Treasury yields rose to almost 1.60%, the highest level in more than one year. The gap between the 5-year and 30-year yields also widened to the highest level in five years.
This performance was mostly because of the general view that the US economic recovery will be swift. This will then force the Fed to start increasing interest rates earlier than expected. The prospects of another $1.9 trillion stimulus package also helped to make this case. As a result, cryptocurrencies, technology companies, and emerging market currencies tumbled.
The BTC/USD pair has risen in the past two days because the yields appear to be softening. The ten-year yield has dropped to 1.405% while the 5-year yield has dropped to 0.686%. The 30-year yield also fell to 2.17%.
Meanwhile, the Bitcoin price is also rising because of strong institutional support. In the past few days, data shows that Coinbase institutional inflows has continued to increase. Similarly, BTC whales have continued to buy. Instead, miners have boosted the amount of Bitcoins they are selling.
BTC/USD Technical Outlook
The four-hour chart shows that the BTC/USD pair dropped to a low of $43,000 last week. This price was along the 50% Fibonacci retracement level on the four-hour chart. The price is now approaching the 23.6% retracement level at $51,300.
Meanwhile, the price has also risen above the first support of the Andrews Pitchfork tool, which is a bullish factor. The 15-period and 25-period weighted moving averages (WMA) have also made a bullish crossover.
Therefore, the pair may continue to rise as bulls continue to buy the dips. However, a complete bullish trend will be confirmed once the price rises above $51,300, the 23.6% retracement level.

