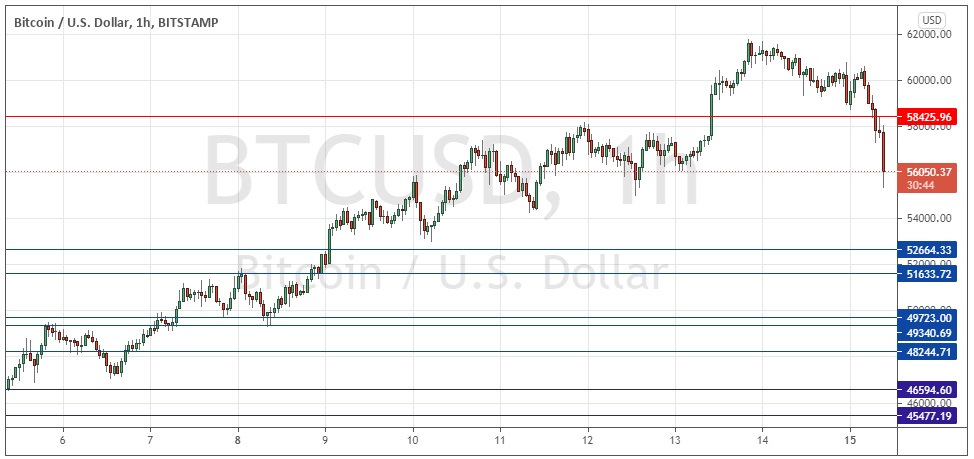
Last Wednesday’s Bitcoin signals were not triggered, as none of the key levels identified were reached that day.
Today’s BTC/USD Signals
Risk 0.50% per trade.
Trades must be taken before 5pm Tokyo time Tuesday.
Long Trade Ideas
Go long after a bullish price action reversal on the H1 time frame following the next touch of $52,664, $51,634, $49,723, or $49,340.
Place the stop loss $100 below the local swing low.
Move the stop loss to break even once the trade is $100 in profit by price.
Take off 50% of the position as profit when the trade is $100 in profit by price and leave the remainder of the position to run.
Short Trade Idea
Go short after a bearish price action reversal on the H1 time frame following the next touch of $58,426.
Place the stop loss $100 above the local swing high.
Move the stop loss to break even once the trade is $100 in profit by price.
Take off 50% of the position as profit when the trade is $100 in profit by price and leave the remainder of the position to run.
The best method to identify a classic “price action reversal” is for an hourly candle to close, such as a pin bar, a doji, an outside or even just an engulfing candle with a higher close. You can exploit these levels or zones by watching the price action that occurs at the given levels.
BTC/USD Analysis
I wrote last Wednesday that there were a few bullish signs – the invalidation of the former resistance level near $55K meant there were no obstacles left to a further price except the all-time high at $58,426.
I thought that it looked likely that Bitcoin would continue to advance and even rise strongly enough to hit a new all-time high, which will likely trigger more speculative frenzy and perhaps a move to considerably higher prices above $6K.
This was a good call as the price rose over the day last Wednesday and got reasonably close to the all-time high price.
Of course, the price went on over subsequent days to make a new all-time high above $60K, but over the last few hours, we have seen the price move down strongly, and trade well below what now looks likely to be resistance at the former all-time high of $58,426.
If the price continues to fall and reach the nearest support level at $52,664 it is likely to produce a bullish bounce and perhaps even another strong rise back up to the $60k area and beyond, so I think such a long trade is the opportunity to look for here today.
If the price instead starts to break down below several of the support levels shown in the below price chart, that will be a very bearish sign and suggest we will be likely to see a dramatic, bubble-bursting decline in the value of Bitcoin.

There is nothing of high importance regarding the USD scheduled for today.
