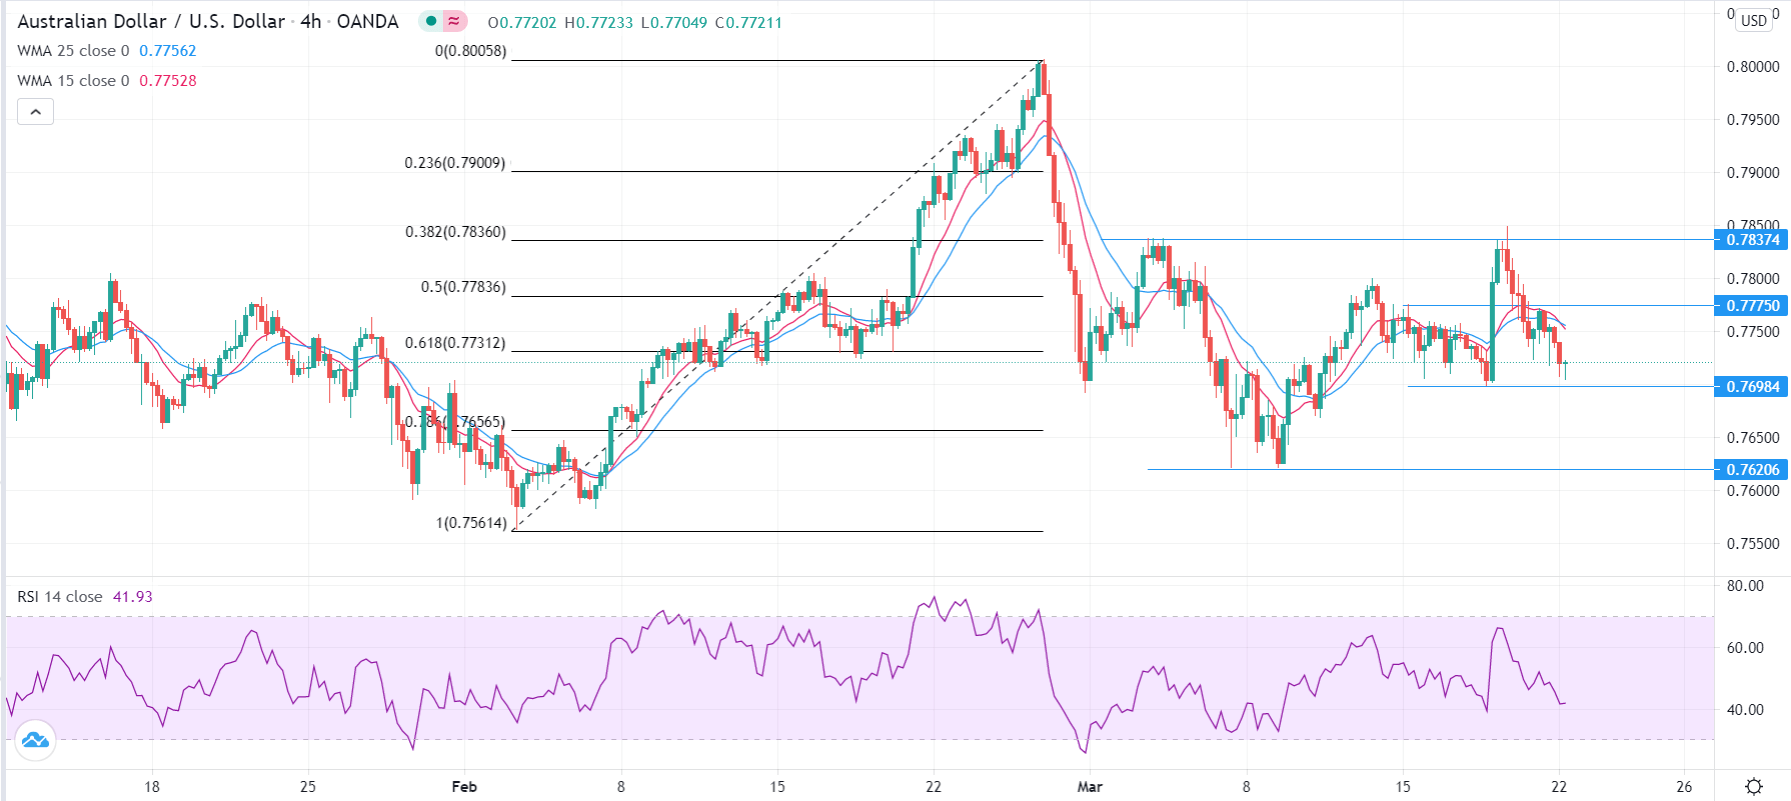
The Australian dollar initially fell during the trading session on Friday but then found support near the 50-day EMA to turn things around and form a slightly supportive candlestick. The market is likely to continue testing this overall choppy area, as we have seen so much in the way of confusion and fear when it comes to bond markets.
The 10-year yields in America have been rising, and that makes the US dollar a bit more attractive. We have recently hit the 1.75% level, which makes the US dollar a bit more resilient against other currencies. The Australian dollar ended up forming a massive shooting star for the month of February, and although we have not kicked off a selling signal from the candlestick, we have gotten awfully close a couple of times. This is why that trendline that I have on the chart may be crucial. If we break down below there, and perhaps even the 0.76 handle, I suspect that the Australian dollar has much further to fall. One thing is for sure: we are clearly sluggish at this point, and not only is the Australian dollar looking very flat, but so is gold.
I believe that the most crucial candlestick on this chart is the Thursday candlestick, because if we can break above the top of that long wick, then we can go looking towards the 0.80 level. The 0.80 level above is the beginning of massive resistance, so I think that if we break above there then the market could really start to take off. There are about 100 points worth of resistance above that area, but if we get above all of that then the market could go looking towards the 0.88 level above.
If we do break to the downside, then it is possible that the market could go looking to the 0.71 handle, possibly even the 0.70 level after that. I do believe that some type of reckoning is coming, and it is simply a matter of following whatever the next bigger move is. We have gotten a bit parabolic over the last several months, but at this point I think that we have to either grind sideways to work off all of this froth, or it is time to pull back rather significantly.