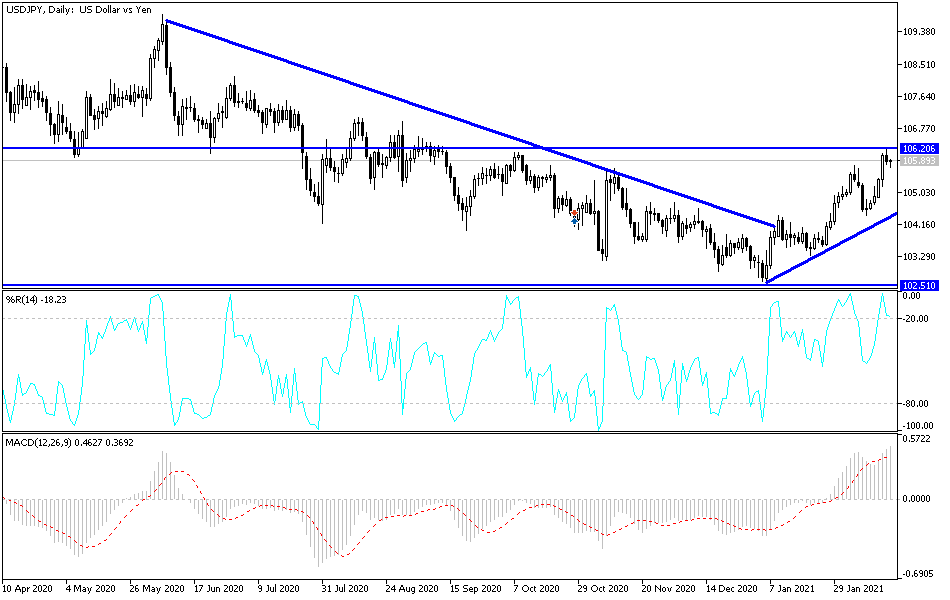
The recent strength of the US dollar pushed the USD/JPY towards the 106.22 resistance level, its highest in five months, before settling around 105.85 as of this writing. This comes despite the positive results of the US economic data and the US administration’s determination to provide more stimulus. Retail sales, industrial production and the Producer Price Index are the latest positive results from the US economy. On the other hand, Fed officials were convinced last month that the US economy and job growth had slowed with the rise in coronavirus cases across the country, noting that the outlook depends heavily on the course of the virus.
According to data from Johns Hopkins University, there were 62,398 new cases of COVID-19 and 1,756 deaths in the United States. The record for new cases was 300,282 on January 2nd and the record for deaths was 5443 on February 12th. The total number of deaths from COVID-19 in the United States has reached 488,103.
The White House said the United States is vaccinating about 1.7 million people daily, up from less than a million a month ago. The new figures from the White House show the steady increase in the frequency of vaccinations during US President Joe Biden's first month in office. The data comes from the Centers for Disease Control and Prevention. A large part of the increase comes from people receiving their second dose of Moderna and Pfizer approved vaccines. The frequency of vaccinations with the first dose has remained largely stable for the past several weeks, hovering around an average of 900,000 injections per day, roughly the same rate as when Biden took office.
Japan launched its coronavirus vaccination campaign yesterday, months after other major economies began giving vaccines, and amid questions about whether Japan will reach enough people fast enough to save the Summer Olympics, which have already been delayed by the pandemic. Despite the recent spike in the number of infections, Japan has largely avoided the kind of catastrophe that has ravaged other rich-country economies and health care systems. But the Olympic games, with billions of dollars at stake, makes the Japanese vaccine campaign crucial.
Japanese officials are well aware that rival China, which has successfully beaten the virus, will host the Winter Olympics next year, adding to the desire to host the games this year.
Technical analysis of the pair:
It appears that the USD/JPY is ready to hit the bullish trend line that connects its lows on its four-hour chart, and the Fibonacci tool shows more levels that buyers may be waiting for. Whereas, 61.8% is closest to the trend line around 105.10, while 38.2% Fibonacci is rising with a previous swing high and is approaching the 105.50 psychological level. Should any of these levels hold, the pair may resume rising to its swing high of 106.24 or higher. The 100 SMA remains above the 200 SMA line to confirm that the overall trend is still up. The gap between the technical indicators is widening to reflect the increasing bullish momentum, and the dynamic 100 SMA support is close to the trend line as well.
The stochastic indicates an overbought or exhaustion area among the buyers, and the downtrend could lead to the continuation of the correction. The RSI indicator is also heading down, so the price may follow suit until an oversold area appears.
Today's economic calendar:
All focus will be on the results of the US data, as the reading of the Philadelphia Industrial Index, the number of weekly jobless claims, then building permits and housing starts will be announced. In addition, the currency pair will be affected by investor risk appetite.

